Ulti-HEP: Wild-type iPSC-derived human hepatocytes
Accurately model liver biology in vitro with functionally mature iPSC-derived human hepatocytes that maintain similar physiological behavior as primary human hepatocytes.

Revolutionizing Liver Models for Drug Discovery
The pharmaceutical industry urgently needs efficient, human-relevant in vitro liver models that can seamlessly integrate into drug discovery pipelines.
These models are crucial for accurately identifying potential drug candidates and evaluating their toxicity profiles.
Traditional liver models, such as cancer cell lines or primary cells, fall short due to inherent limitations in functionality, scalability, and consistency. This is why we have created Ulti-HEP, human induced pluripotent stem cell (iPSCs) derived hepatocytes, which overcomes the limitations of traditional models.

Why Ulti-HEP?
Our cells are extensively characterized to meet the demanding criteria of the pharmaceutical industry, Ulti-HEP provides a robust platform for advancing liver research, ensuring better predictions, and accelerating the journey from discovery to treatment.
Human-relevant functionality
Highly metabolic, replicating the natural processes of human hepatocytes which last much longer than primary cell lines in culture.
High performance
Are well suited for predictive toxicology and drug efficacy screening assays. Unlike primary cells, Ulti-HEP can also be genetically edited in order to create bespoke disease models too.
Consistent & scalable
Designed to deliver reliable, reproducible results for research since they are sourced from a single donor. Researchers can select from several donors to suit their research needs.
Ulti-HEP’s Advantages
Derived from induced pluripotent stem cells (iPSCs), our Ulti-HEP cells exhibit all human-specific metabolic pathways, giving you relevant and reproducible data, leveraging the consistency of iPSC culture.
Express comparable levels of liver maturity markers to primary human hepatocytes
Express higher levels of urea cycle markers and secrete higher levels of urea compared to liver carcinoma cell lines
Ulti-HEP demonstrate a functional gluconeogenesis pathway
Demonstrate comparable levels of CYP450 markers and CYP3A4 activity to primary human hepatocytes
They show functional localization and function of ASGR1 for GalNAc-dependent drug deliveries
Technical Data
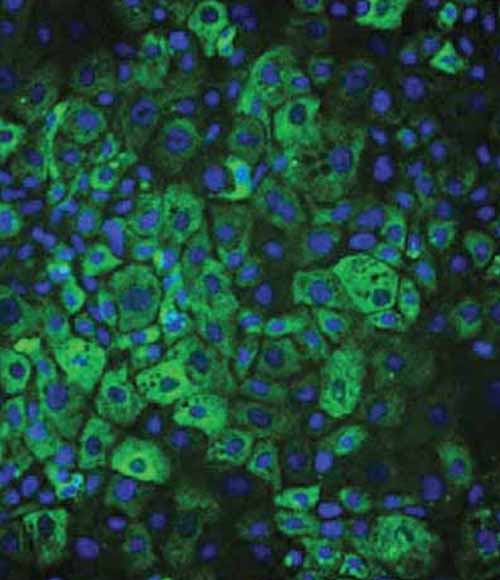
Morphology
Ulti-HEP demonstrate the characteristic hepatocyte cobblestone morphology.

Maturity marker analysis
Ulti-HEP express similar levels of liver maturity markers compared to primary human hepatocytes (PHH).


Urea cycle marker analysis
Ulti-HEP express higher levels of urea cycle markers and secrete higher levels of urea compared to liver carcinoma cell lines.

Figure 3: A) Protein expression levels of the urea cycle enzymes OTC, ASS1, ASL, CPS1, and ARG1 in liver carcinoma HepG2 cells and Ulti-HEP.

Functional gluconeogenesis
Ulti-HEP demonstrate a functional gluconeogenesis pathway and respond to gluconeogenesis inducers.

Figure 4: A) Simplified schematic of the gluconeogenesis pathway within human liver.


CYP450 expression and activity
Ulti-HEP demonstrate comparable levels of CYP450 markers and CYP3A4 activity to primary human hepatocytes.

Figure 5: A) mRNA expression levels of Phase I CYP450 genes in liver carcinoma HepG2 cells, Ulti-HEP, and primary human hepatocytes (PHH).

Figure 5: B) Basal CYP3A4 activity in liver carcinoma HepG2 cells, Ulti-HEP, and PHH. mRNA data were normalized to the housekeeping gene 18S rRNA and are presented as mean ±SEM of n=3-4 independent experiments. CYP3A4 activity data were normalized to ATP levels and are presented as mean ±SEM of n=3-5 independent experiments. For PHH data, cells from 3 independent donors were used.
ASGR1 expression and function
Ulti-HEP demonstrate functional membrane localization and activity of the Asialoglycoprotein receptor 1 (ASGR1).

Figure 6: A) Representative immunocytochemistry pictures showing the localization of ASGR1 in the Ulti-HEP membrane. Cells were counterstained with the membrane marker E-cadherin and DAPI.

Figure 6: B) The effect of ASGR1 in the transport of GalNAc-siRNA conjugate targeting GAPDH in Ulti-HEP using GalNAc-Cy3 staining and qPCR. Data are presented as mean±SEM of n=3-4 independent experiments. mRNA expression data were normalized to 18S rRNA. NTC: non-template control.
Key Publications
Our Ulti-HEP have been used in several peer-reviewed publications, you can learn more about how they have helped to accelerate research below:
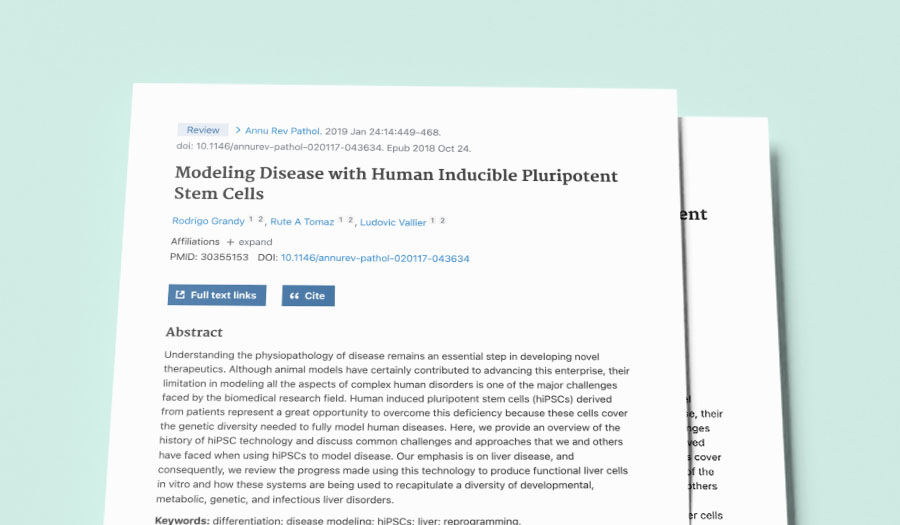
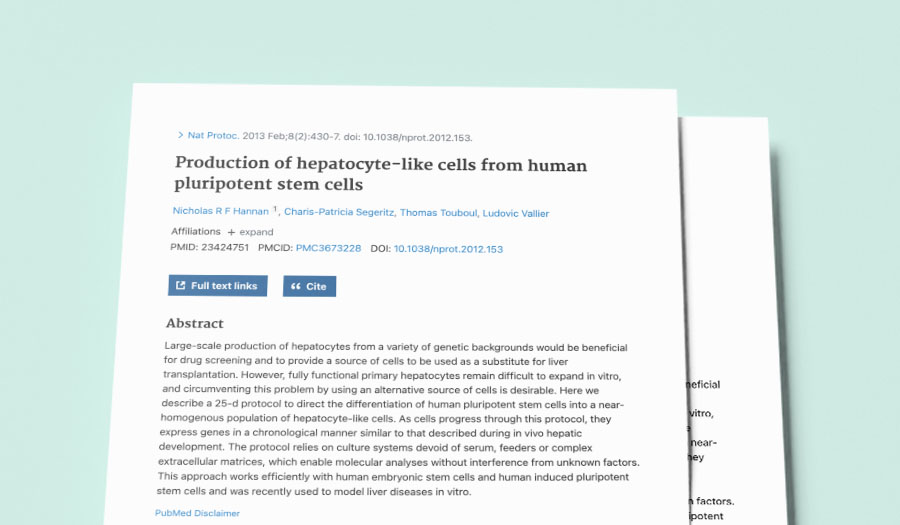
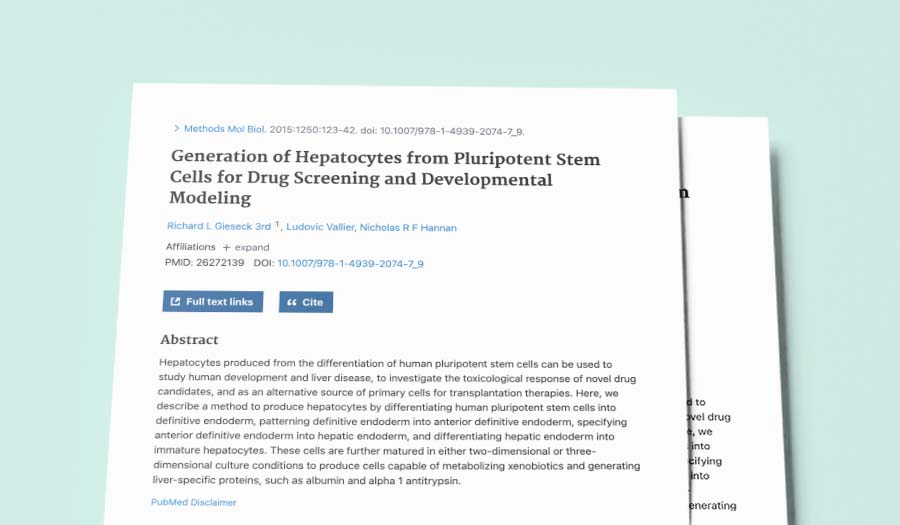
Scientific paper
Generation of Hepatocytes from Pluripotent Stem Cells for Drug Screening and Developmental Modeling
Learn moreFrequently asked questions
Do Ulti-HEPs express ASGR1?
Yes, ASGR1 and ASGR2 has been detected by qPCR analysis and ICC and has been shown to localize on the cell membrane.
Do they have a functional urea cycle?
Yes this has been characterized by gene expression profiling, Western blot analysis and Ornithine stimulated functional analysis.
Can you see CYP expression activity?
Expression of CYPs is detectable by qPCR analysis, but they are lower than Primary Human Hepatocytes (PHH).

