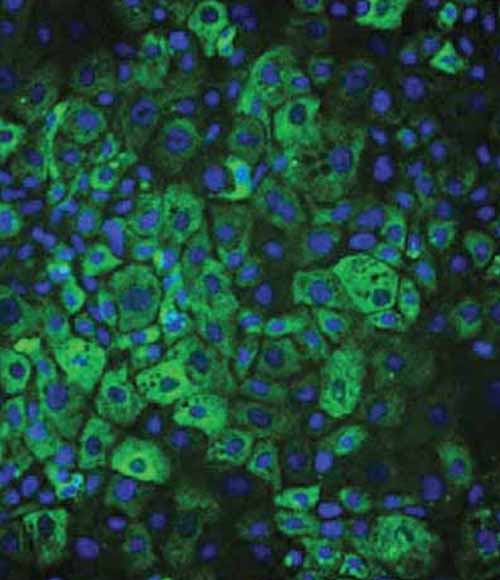
A1ATD disease modelled hepatocytes
DefiniGEN provide disease modelled alpha-1 antitrypsin deficiency hepatocytes which are highly functional patient-derived human hepatocytes.

Phenotypically relevant.
DefiniGEN provide disease modelled alpha-1 antitrypsin deficiency hepatocytes which are highly functional patient-derived human hepatocytes. The cells are generated using the dermal fibroblasts from an alpha-1 antitrypsin (A1ATD) disorder patient carrying the ‘Z’ (E342K) point mutation in the A1ATD gene SERPINA1. This mutation leads to the formation of mutant A1ATD polymers that ultimately cause liver and lung damage. DefiniGEN’s A1ATD patient derived hepatocytes represent an optimized disease model for drug discovery applications and are an effective tool for elucidating the underlying mechanisms of the disease.
Disease circuit verified
Disease circuit verified ZZ E342K mutation in the SERPINA1 gene
Produce at scale
Standardized cell product >98% human hepatocyte cells producing reproducible and relevant data
Donor background
Verified wild-type donor genetics and karyotype
Normal physiology
Optimized work flow we can deliver industrial quantities of cryopreserved cell products to fit client specification
Technical Data
Ulti-HEP A1ATD cell morphology
The Ulti-HEP A1ATD cells are patient representative human hepatocytes. When thawed and plated Ulti-HEP A1ATD cells form a monolayer with typical hepatocyte cobblestone morphology.

Figure 1a): Representative brightfield images of wild-type and A1ATD iPSCs and Ulti-HEP demonstrating the round iPSC colony and hepatocyte cobblestone morphology, respectively.

Figure 1b): mRNA expression levels of key hepatocyte markers albumin (ALB) and alpha-1-antitrypsin (A1AT) in wild-type Ulti-HEP, CRISPR/Cas9-derived A1ATD Ulti-HEP, and primary human hepatocytes (PHH).
CRISPR/Cas9-derived A1ATD Ulti-HEP demonstrate the disease phenotype

Figure 2: Immunostaining and quantification of intracellular levels of polymeric A1AT in A1ATD Ulti-HEP compared to wild-type Ulti-HEP. Nuclei were counterstained with DAPI (blue). Mean fluorescence intensity (MFI) was normalised to nuclei number. Results are presented as mean ± SEM of n=3 independent experiments. **p<0.01
Response of CRISPR/Cas9-derived A1ATD Ulti-HEP in autophagy inducing agents and RNA-based therapeutics

Figure 3a): Representative immunocytochemistry pictures of intracellular accumulation of polymeric A1AT in A1ATD Ulti-HEP in response to treatment with different concentrations of carbamazepine (CBZ) following immunostaining with polymer-specific A1AT antibody.

Figure 3b): Quantification of intracellular accumulation of polymeric A1AT in A1ATD Ulti-HEP in response to treatment with different concentrations of carbamazepine (CBZ) following immunostaining with polymer-specific A1AT antibody.
CRISPR/Cas9-derived A1ATD Ulti-HEP demonstrate the disease phenotype.

Figure 4a): Representative images of total and polymeric A1AT staining in CRISPR/Cas9-derived A1ATD Ulti-HEP transfected for 72 hours with either vehicle, scrambled control, or siRNA targeting the A1AT gene. Nuclei were counterstained with DAPI (blue). All results are presented as mean ± SEM of n=3 independent experiments. **p<0.01

Figure 4b): Quantification of total and polymeric A1AT staining in CRISPR/Cas9-derived A1ATD Ulti-HEP transfected for 72 hours with either vehicle, scrambled control, or siRNA targeting the A1AT gene. Nuclei were counterstained with DAPI (blue). All results are presented as mean ± SEM of n=3 independent experiments. **p<0.01


