Liver
Alpha-1 antitrypsin deficiency
Optimized bioassays for the preclinical screening of small molecules, siRNA and oligo therapeutic candidates and base editing approaches
A1ATD drug screening platform
DefiniGEN provide iPSC-derived disease modelled hepatocytes of Alpha-1 antitrypsin (A1AT) deficiency; associated with the PiZ variant of the Alpha-1 antitrypsin, caused by a (G>A) point mutation at codon 342 (Glu342Lys) in exon 5 of the SERPINA1 gene. Using CRISPR gene-editing we successfully introduced the PiZ mutation into our in-house iPSC line, differentiated to hepatocytes using our OptiDIFF process and screened for key hepatic and disease markers using high content imaging.
The resulting cells were shown to have a strong hepatic phenotype and to display increased intracellular expression of polymeric A1AT which is characteristic of Alpha- antitrypsin deficiency. Subsequently we assessed the suitability of these cells for screening of small molecule and RNA-based therapies by transferring them to multiwell plates and treating with reference compounds (in particular Carbamazepine) or RNA-modulating molecules.
The cells were able to demonstrate dose-dependent restoration of function across a broad range of drug concentrations, these data confirm both sensitivity and specificity of response to treatment and therefore this disease model is highly applicable to candidate drug screening in A1ATD.
Methodology
To initially validate hepatocyte function in DefiniGEN's iPSC-derived HLCs, our cells were differentiated under DefiniGEN's OptiDIFF platform, and differentiation was assessed by measuring mature hepatocyte marker expression (albumin, A1AT) as well as presence of active gluconeogenesis/glycogenolysis. Albumin and A1AT expression levels were determined at mRNA and protein level by qPCR and ICC, respectively, and compared to levels seen in primary human hepatocytes (PHH). Active gluconeogenesis/glycogenolysis was confirmed by measuring glucose secretion following glucagon stimulation in a time-dependent manner using a commercially available glucose kit.
Following successful validation of hepatocyte functionality, the SERPINA1 mutation E342K (Glu342Lys) was introduced in DefiniGEN's wild-type iPSCs by CRISPR gene editing. iPSC pluripotency was assessed by qPCR (NANOG, SOX2, OCT4 expression), and genotype confirmation by Sanger sequencing. Finally, accumulation of polymeric A1AT and response to autophagy-inducing compounds and nucleotide-based therapeutics was determined by ICC using a high-content imaging analyzer.
Results
1) Characterization of our hepatocyte-like cells
Using our proprietary differentiation protocol, which derives a very pure definitive endoderm population early in the cell generation process, DefiniGEN's terminally differentiated hepatocytes have comparable levels of key markers (albumin, A1AT, HNF4a and AFP) to primary human hepatocytes (PHH).
They display low density lipoprotein (LDL) incorporation, a demonstrably functional urea cycle, gluconeogenesis/glycogenolysis and have also been characterized to show the conservation of many cellular processes which are vital for in the in-vitro modeling of monogenic liver conditions.
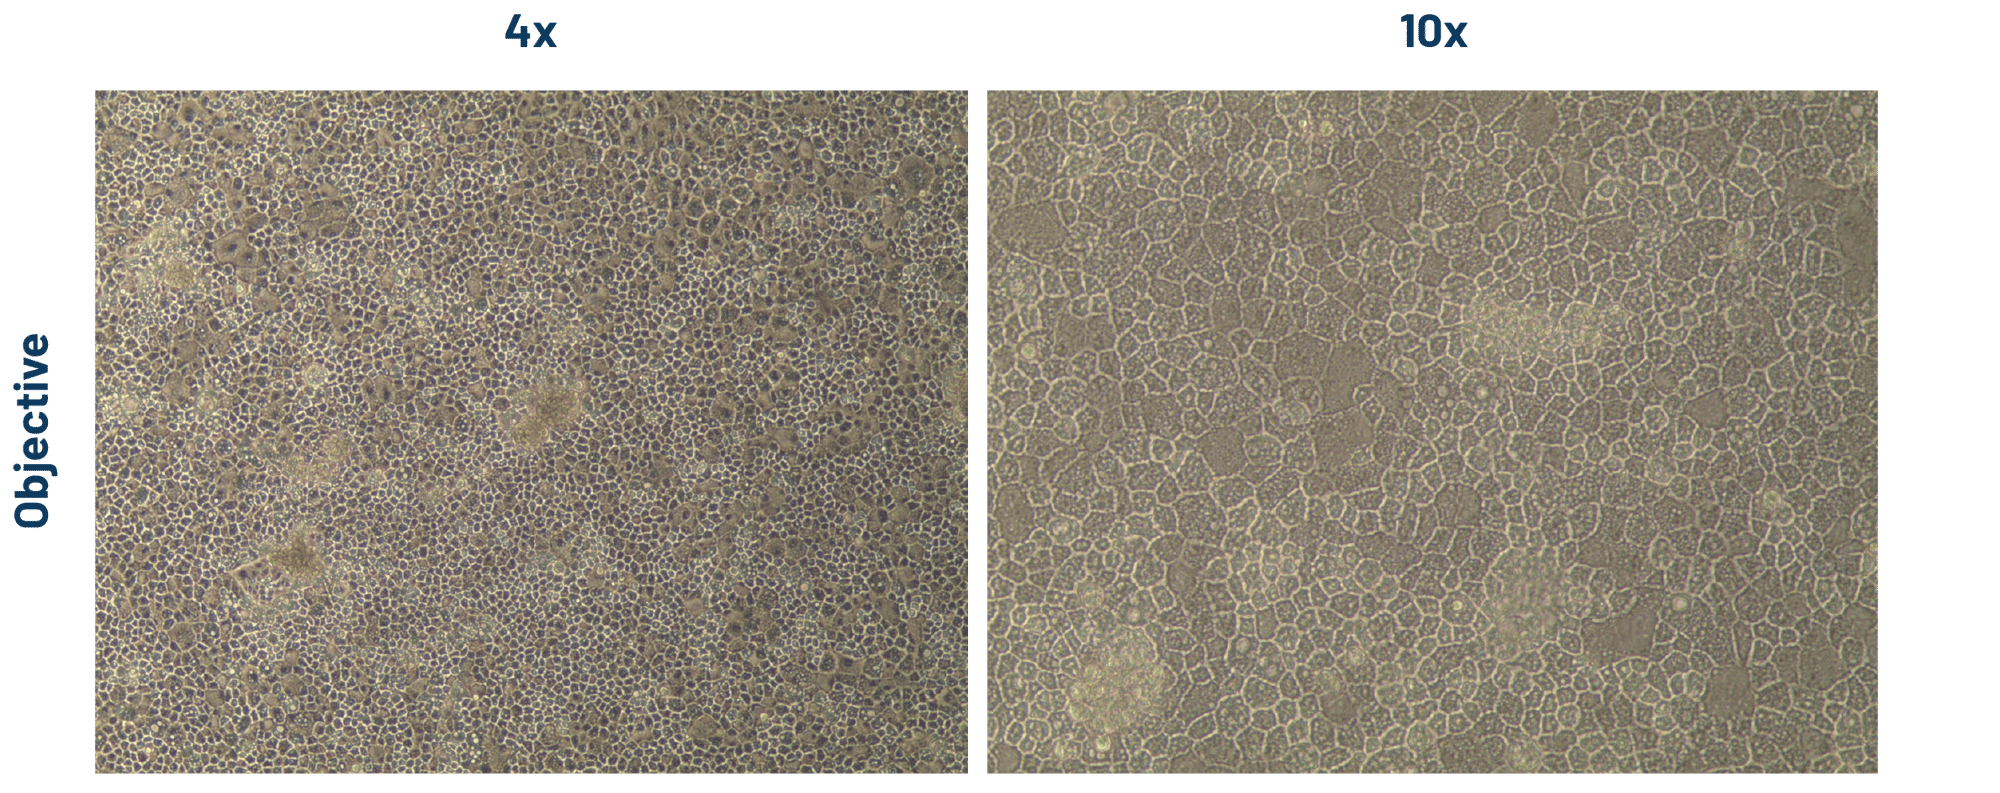
Figure 2. DefiniGEN hepatocyte-like cells (HLCs) demonstrate the characteristic cobblestone morphology, and the presence of a uniformed monolayer following >3 weeks of iPSC differentiation.

Figure 3. A) mRNA expression levels of albumin (ALB) and alpha-1-antitrypsin (A1AT) in DefiniGEN mature hepatocyte-like cells (HLCs) and primary human hepatocytes (PHH). B) Representative pictures of mature HLCs revealing protein expression of the hepatocyte maturity markers albumin (green) and alpha-1 antitrypsin (red). Data are presented as means ±SD of n=3 biological replicates. mRNA expression data were normalised to PPIA.

Figure 4. A) Simplified schematic on the gluconeogenesis/glycogenolysis pathways within the human liver. B) Media glucose levels from mature HLCs treated with glucose-free media for 1h and 6h with or without glucagon, suggesting the de novo synthesis of glucose from non-lipid precursors, accompanied by functional glycogenolysis pathway additionally contributing to total glucose levels. Data are presented as mean ±SD of n=2 technical replicates.
2) CRISPR Alpha-1 Antitrypsin Deficiency Model
DefiniGEN have an iPSC line which has been selected out of many hundreds of lines for its robust differentiation characteristics, and, by using CRISPR gene editing, have generated a ZZ mutant with an otherwise healthy genetic background for primary screening activities.

Figure 5. The area highlighted in yellow shows homozygous E342K mutation (GAG>AAG) in the clone sequence.
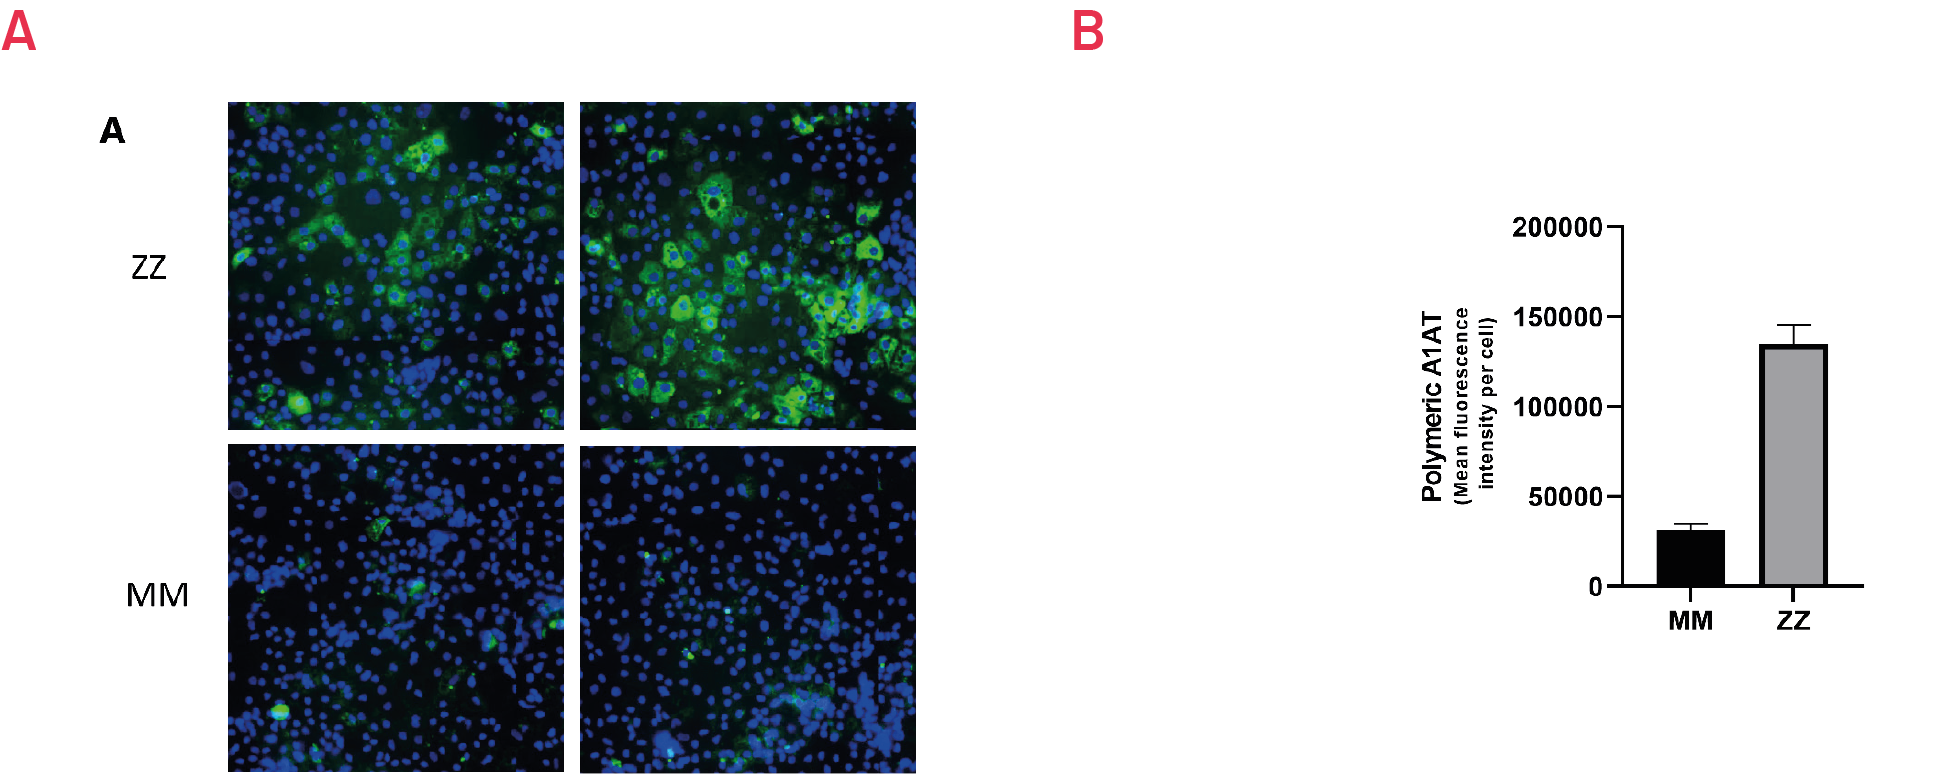
Figure 6. Immunostaining with polymer-specific A1AT antibody shows intracellular accumulation of polymeric A1AT in ZZ hepatocyte-like cells (HLCs) vs. isogenic MM HLCs. B) Quantification of the intracellular levels of polymeric A1AT in ZZ hepatocyte-like cells (HLCs) vs. isogenic MM HLCs. Mean fluorescence intensity (MFI) was normalized to number of nuclei. Results presented as mean ±SEM of n=3 independent experiments.
3) Phenotypic Validation
Polymer build up in the livers of A1ATD patients, and DefiniGEN's model directly measures hepatic polymer accumulation which is also used as a clinical endpoint for the in-vivo testing of candidate therapeutics.
An optimized immunofluorescent bioassay for polymeric A1AT gives a reliable endpoint, and treatment windows for different molecular entities have been established.
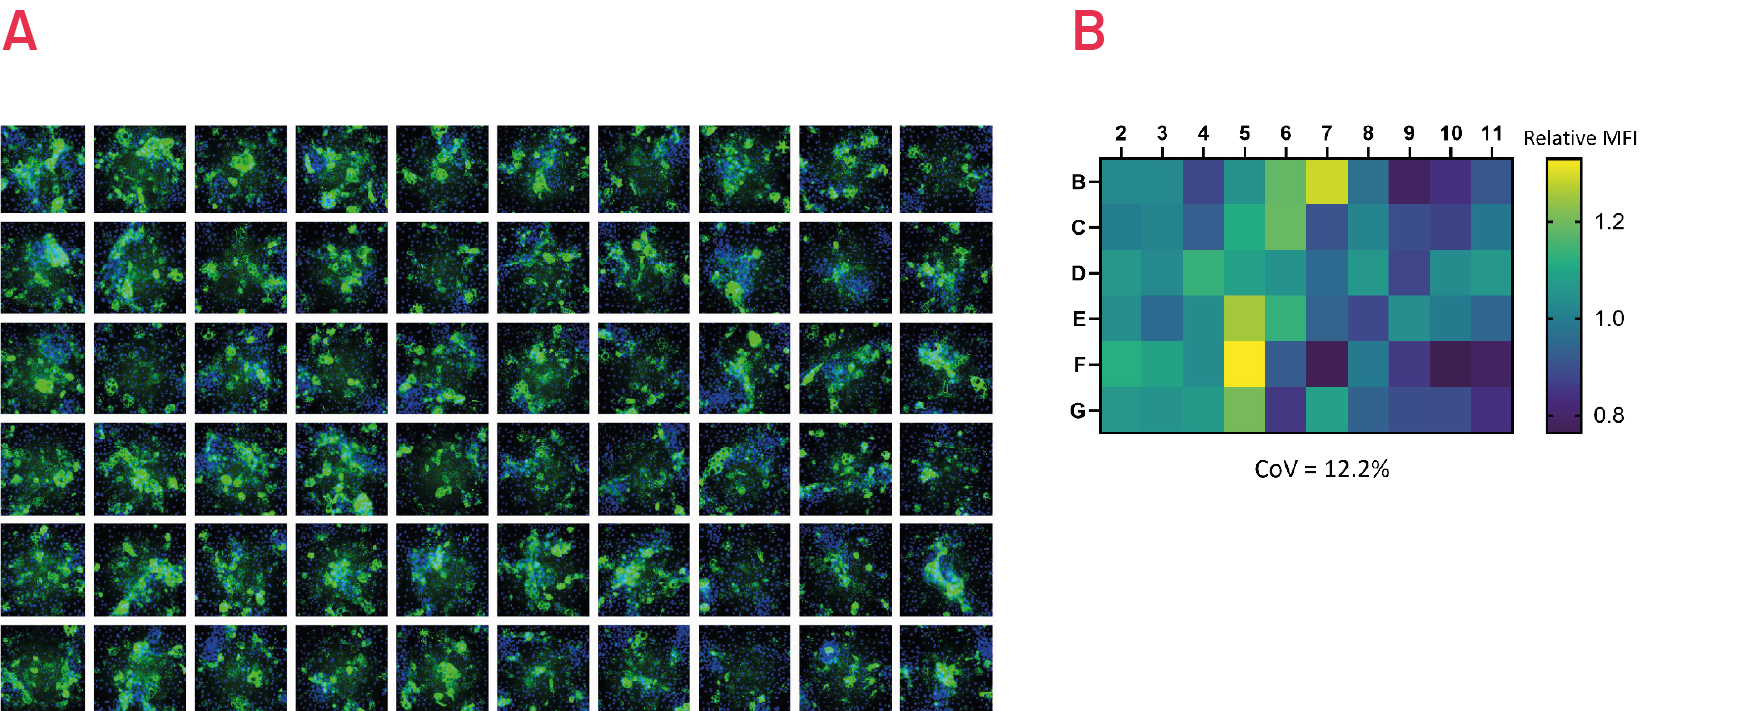
Figure 7. Immunostaining with polymer-specific A1AT antibody shows levels of polymeric A1AT in ZZ-HLCs across the central wells of a 96 well plate. Representative images of 3 independent experiments. B) Quantification of the intracellular levels of polymeric A1AT in ZZ-HLCs across the central wells of a 96 well plate relative to the average of the plate set as 1. Results expressed as average from n=3 independent experiments.
4) Phenotypic Recovery
A1ATD HLCs respond to reference drug carbamazepine (CBZ)
Autophagy-inducing compounds including carbamazepine have been shown to accelerate the clearance of polymeric A1AT in hepatocytes, and DefiniGEN have used this compound as our standard positive control in every plate run for small molecule screens.
Recent advances in gene therapies and innovative small molecule approaches offer new hope for curative treatments, however there is a paucity of pre-clinical human models available to assess efficacy. DefiniGEN offer screening services on metabolically competent hepatocytes with a mature phenotype, to help support drug development for this indication and generate valuable human data for your candidate therapeutics. Our cells give robust responses to carbamazepine and other autophagy inducing small molecules.
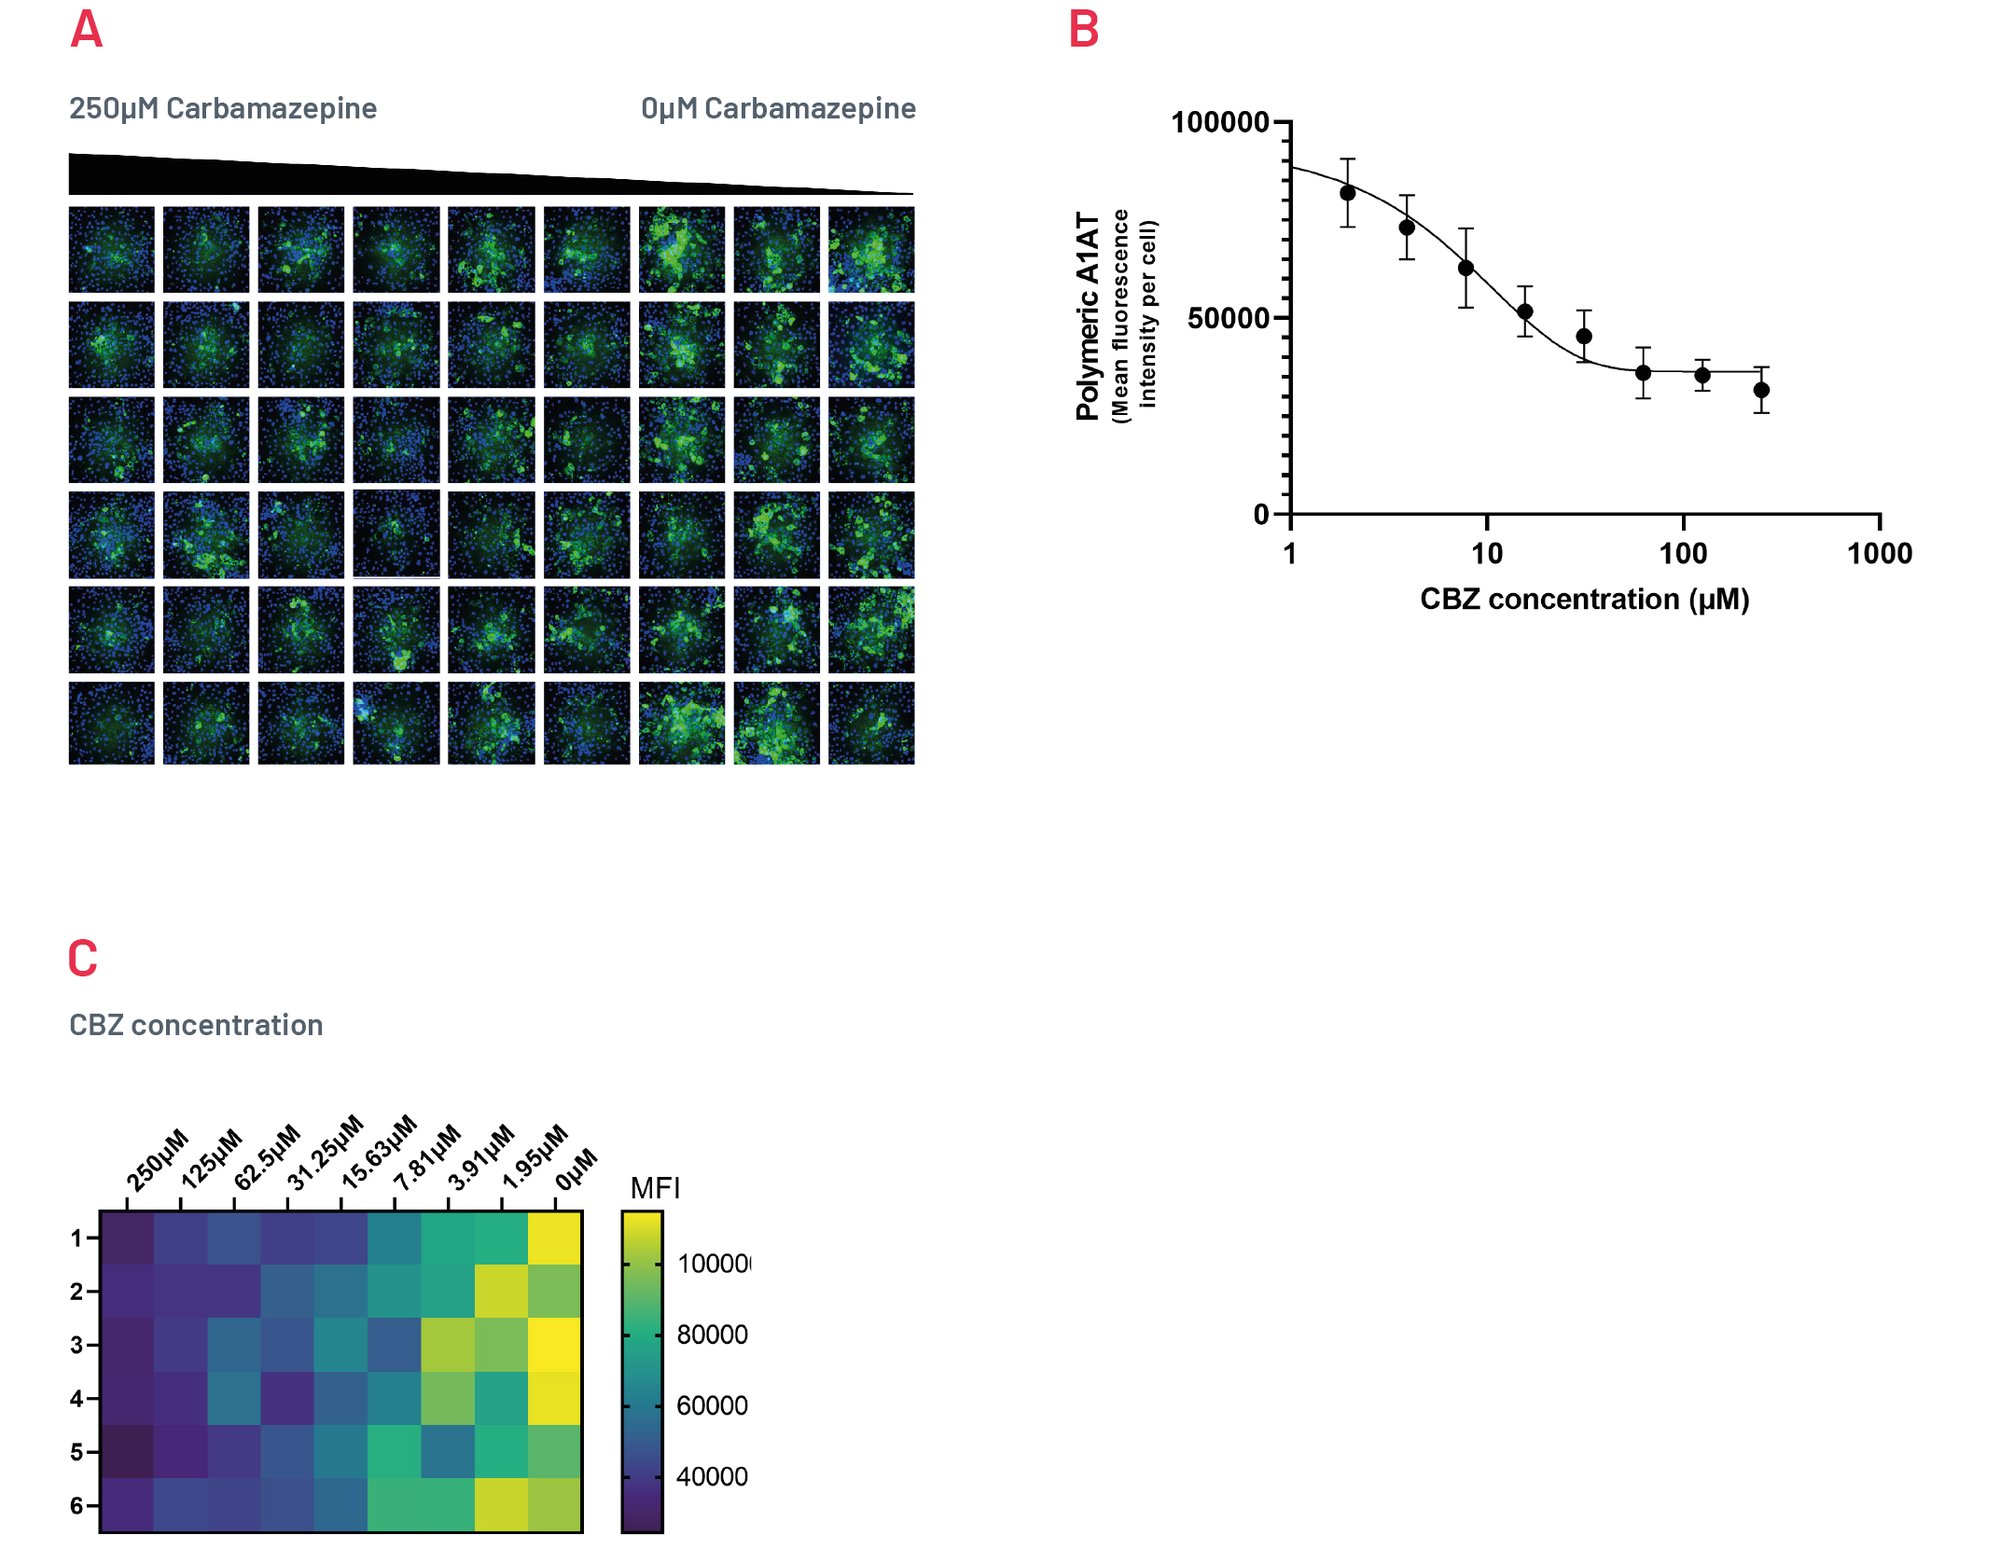
Figure 8. Intracellular accumulation of polymeric A1AT in ZZ-HLCs in response to treatment with different concentrations of Carbamazepine following immunostaining with polymer-specific A1AT antibody. B) Quantification of the intracellular levels of polymeric A1AT showing MFI per cell upon treatment with CBZ. Results expressed as mean ±SEM of n=4 independent experiments. C) Heatmap showing quantification of polymeric A1AT across a 96 well plate upon treatment with decreasing concentrations of CBZ, representative of 4 independent experiments.
A1ATD HLCs show little plate to plate variability in their response to CBZ
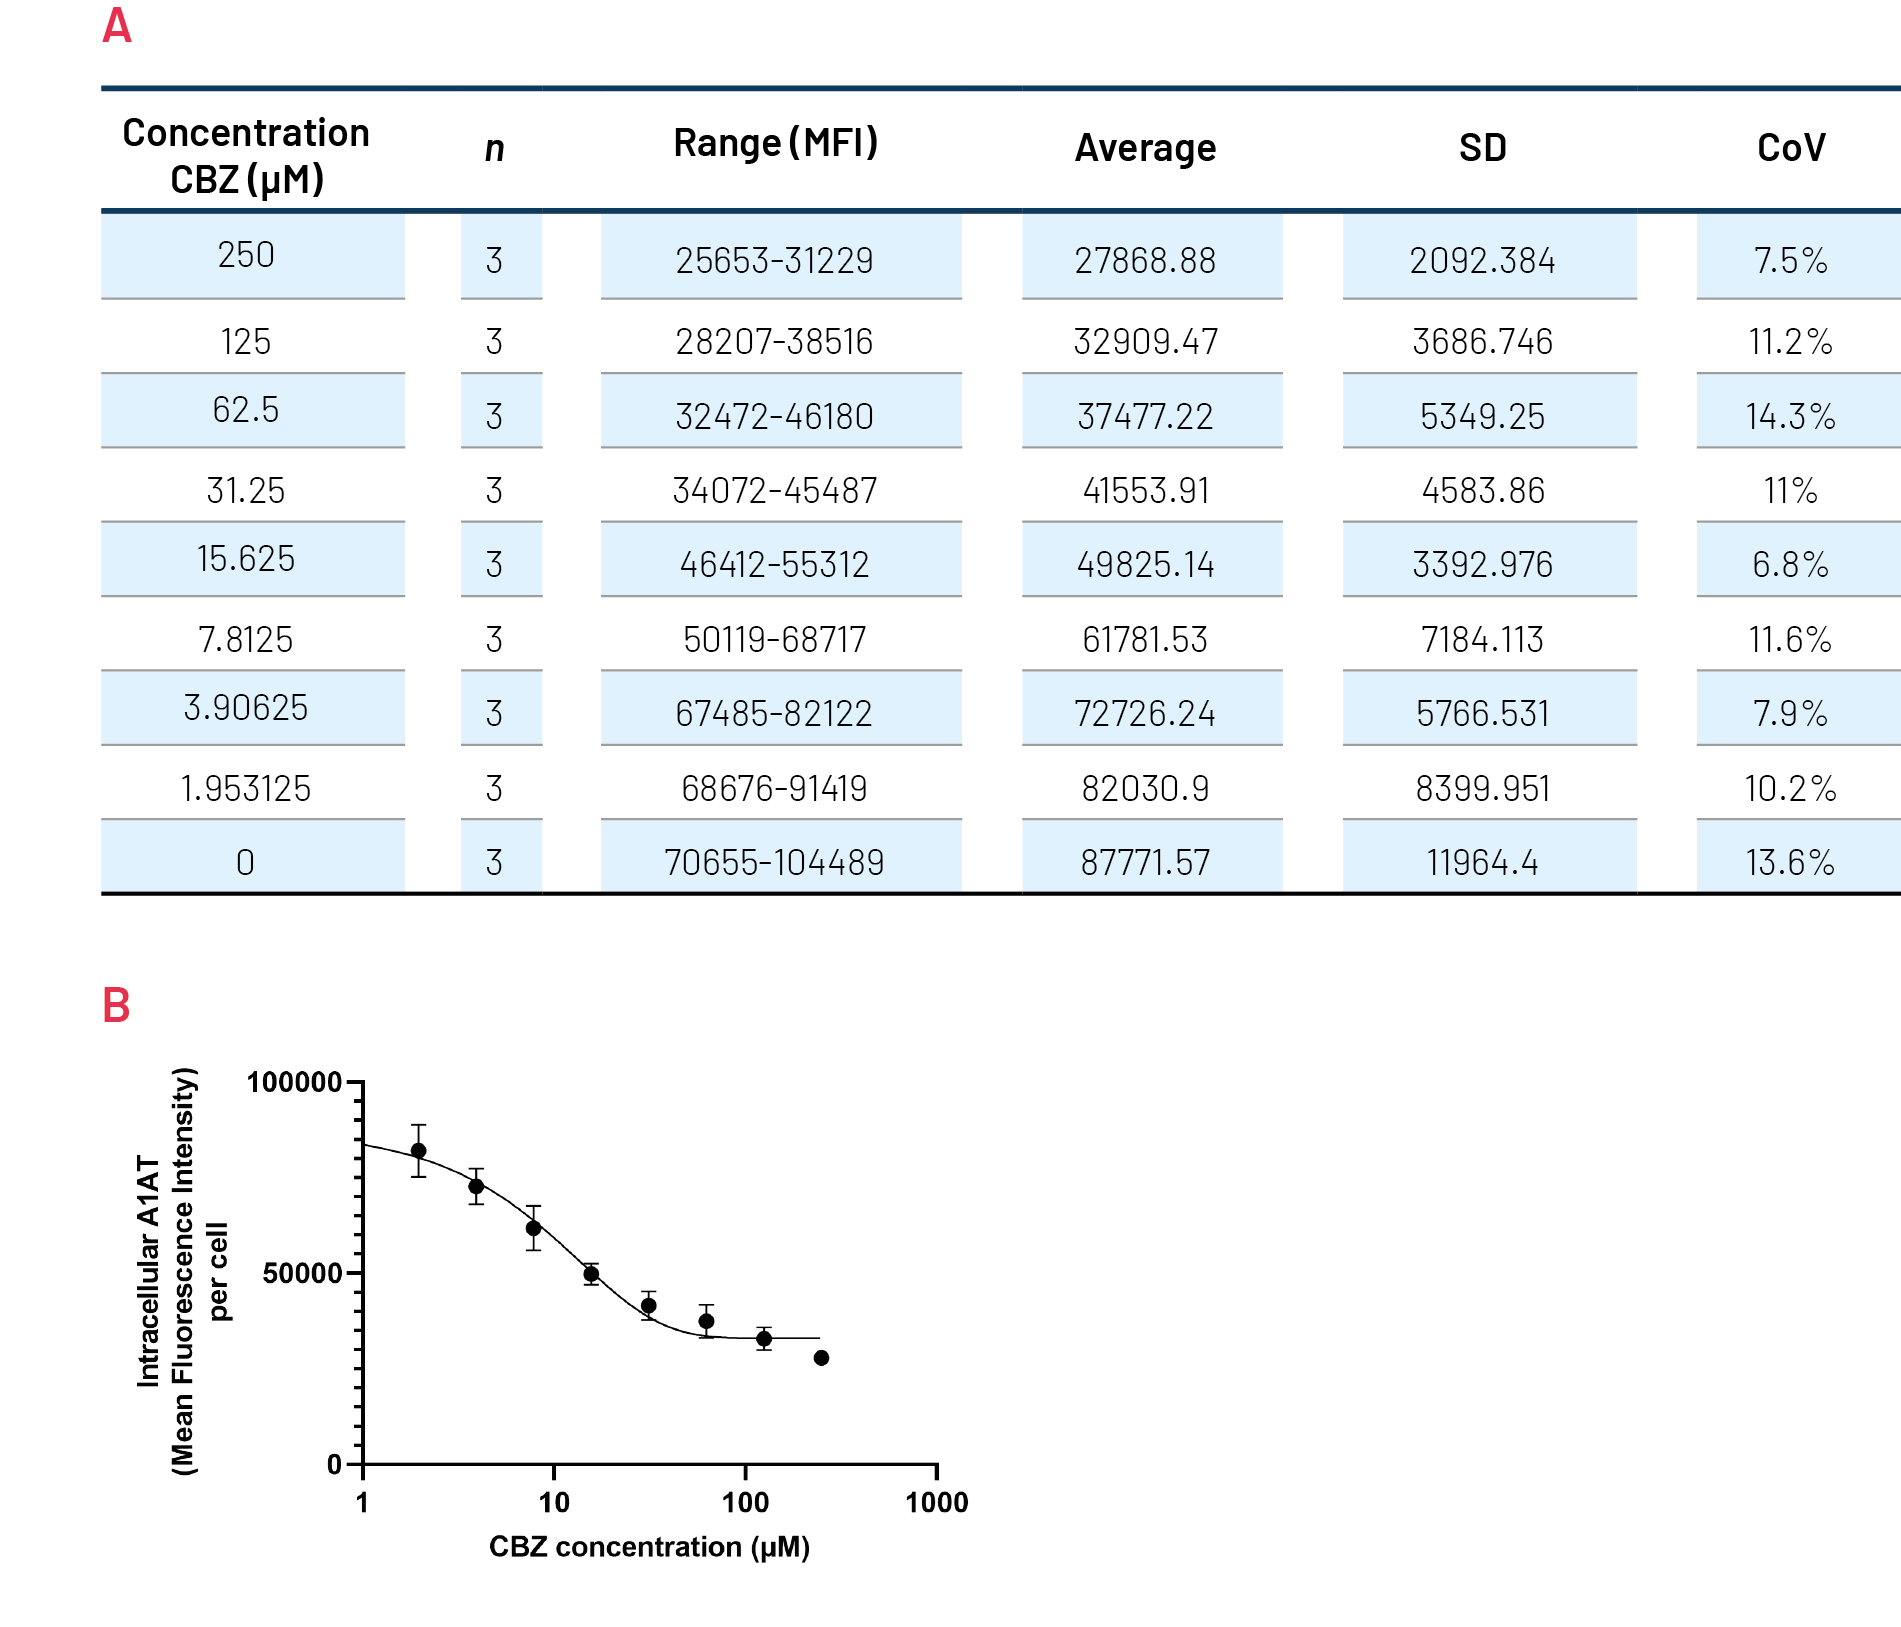
Figure 9. Quantification of polymeric A1AT in ZZ-HLCs in response to increasing concentrations of Carbamazepine (CBZ) across several plates. B) Quantification of the intracellular levels of polymeric A1AT showing mean fluorescence intensity (MFI) per cell. An average of 3 plates run in parallel.
4.1) Phenotype Recovery using autophagy compounds
A1ATD HLCs respond to novel autophagy-inducing compounds
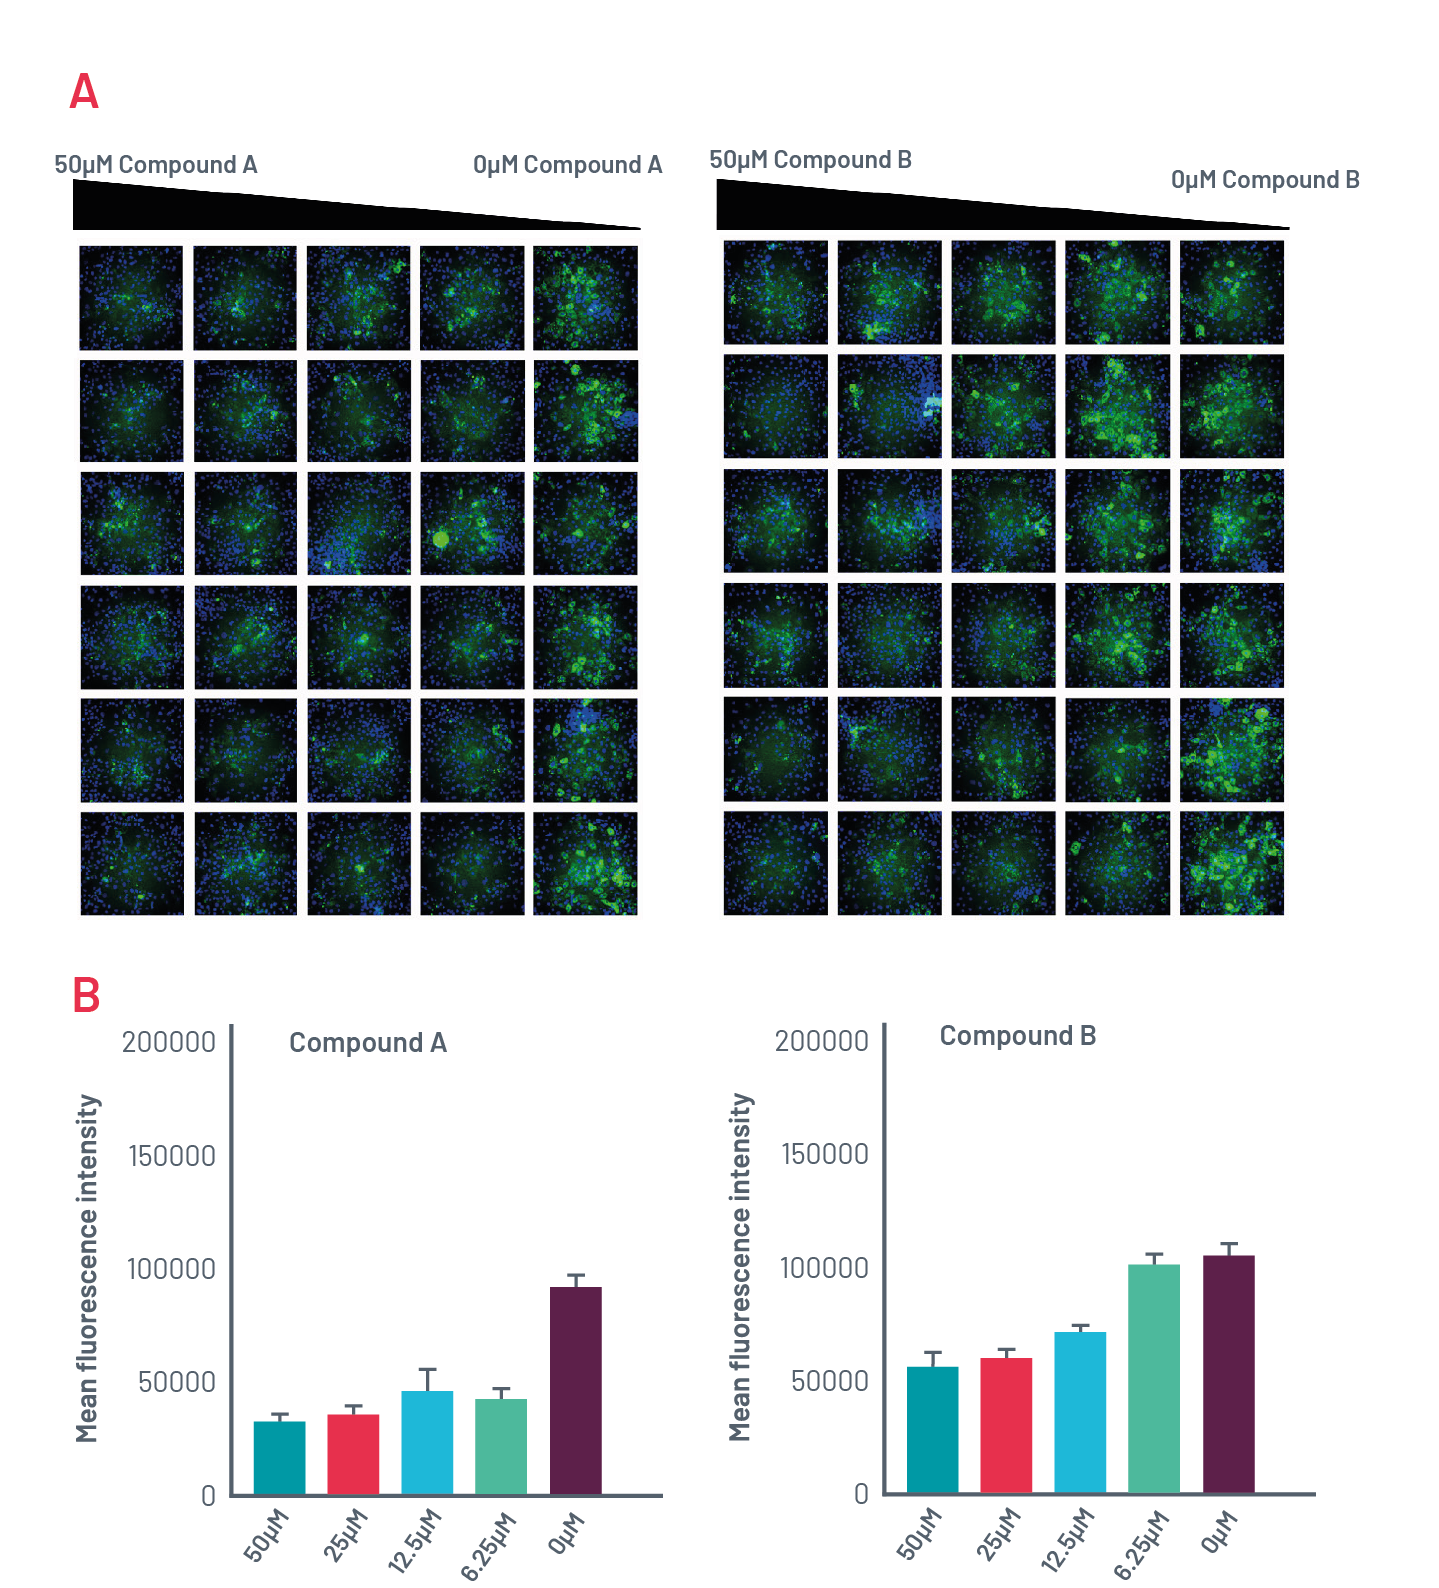
Figure 10. A) Intracellular accumulation of polymeric A1AT in ZZ-HLCs in response to two compounds that induce autophagy following immunostaining with polymer-specific A1AT antibody. B) Quantification of the intracellular levels of polymeric A1AT in cells treated with different concentrations of compounds that induce autophagy.
4.2) Phenotype Recovery using Nucleotide based therapeutics
Def-HEP A1ATD cells are readily transducible or transfectable, and lend themselves to the evaluation of gene therapy approaches, from siRNA to viral vectors or base-editing approaches. Our clients can send their compounds or reagents directly to our facilities in Cambridge UK and data can typically be generated in 6-8 weeks.
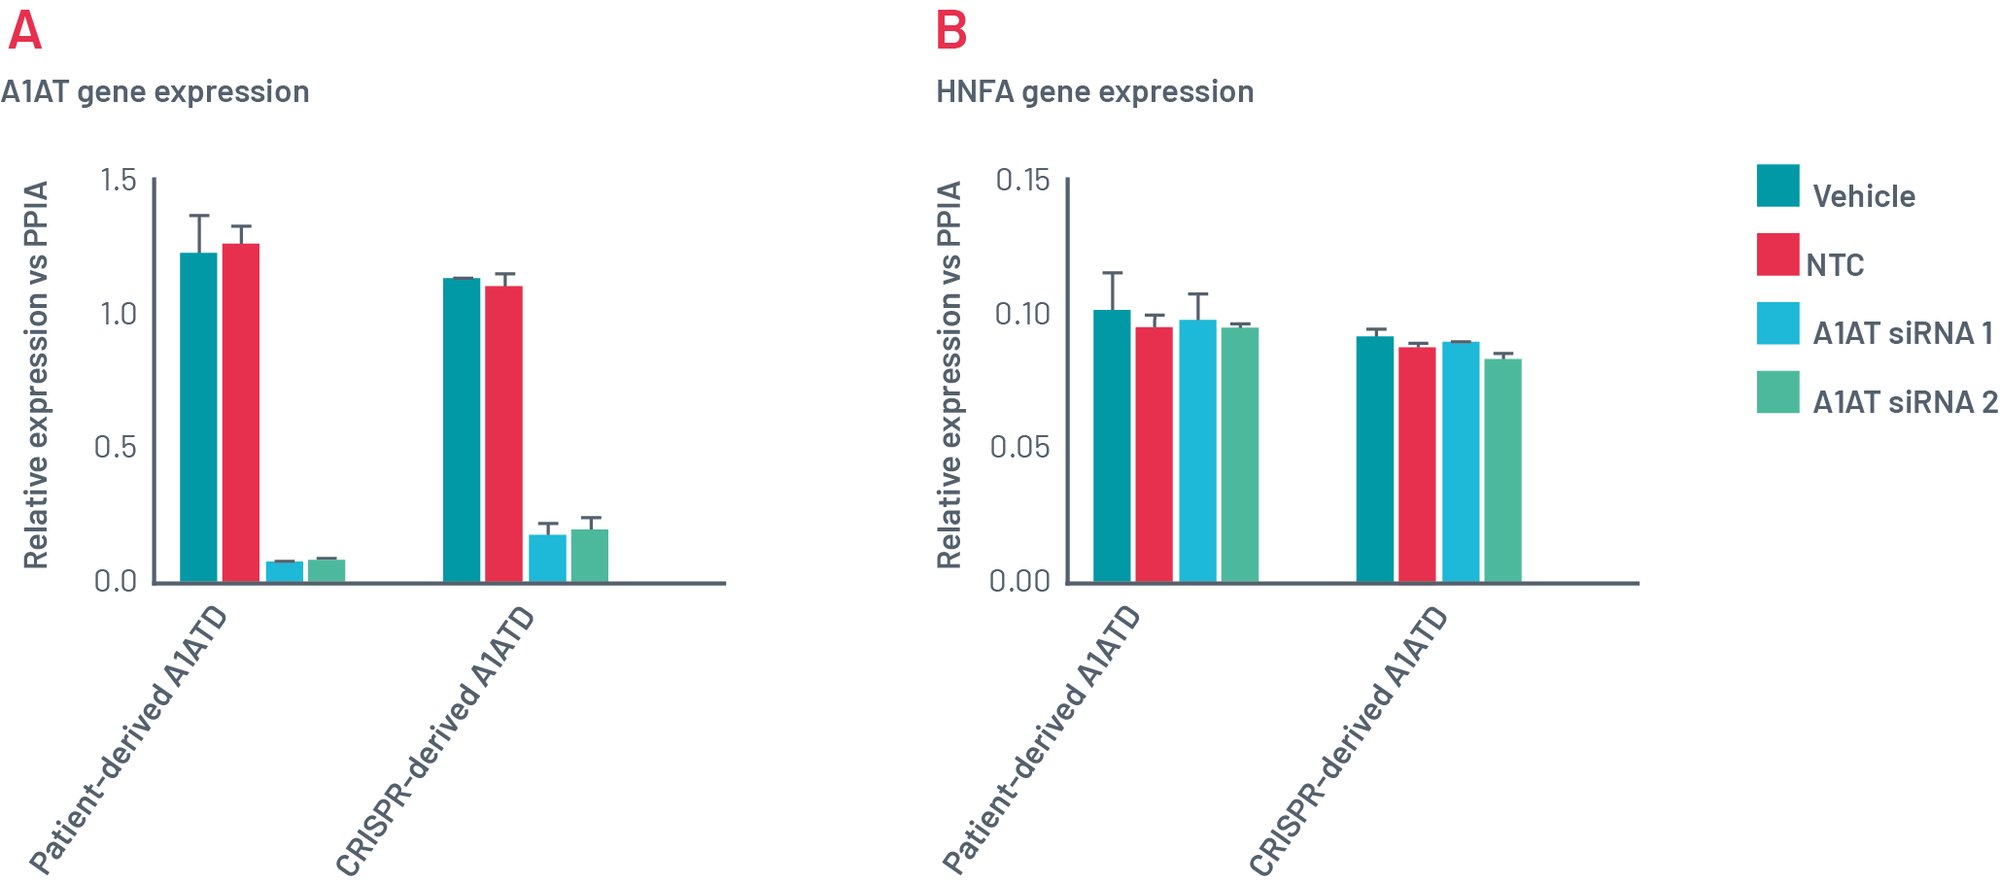
Figure 11. Gene expression of Def-HEP A1ATD 48h after transfection with scramble siRNA (NTC) and two different combinations of siRNA targeting SERPINA1 (A1AT). Gene expression of A1AT dramatically decreases with both sets of siRNAs (A) but other genes such as HNF4a (B) remains consistently expressed.
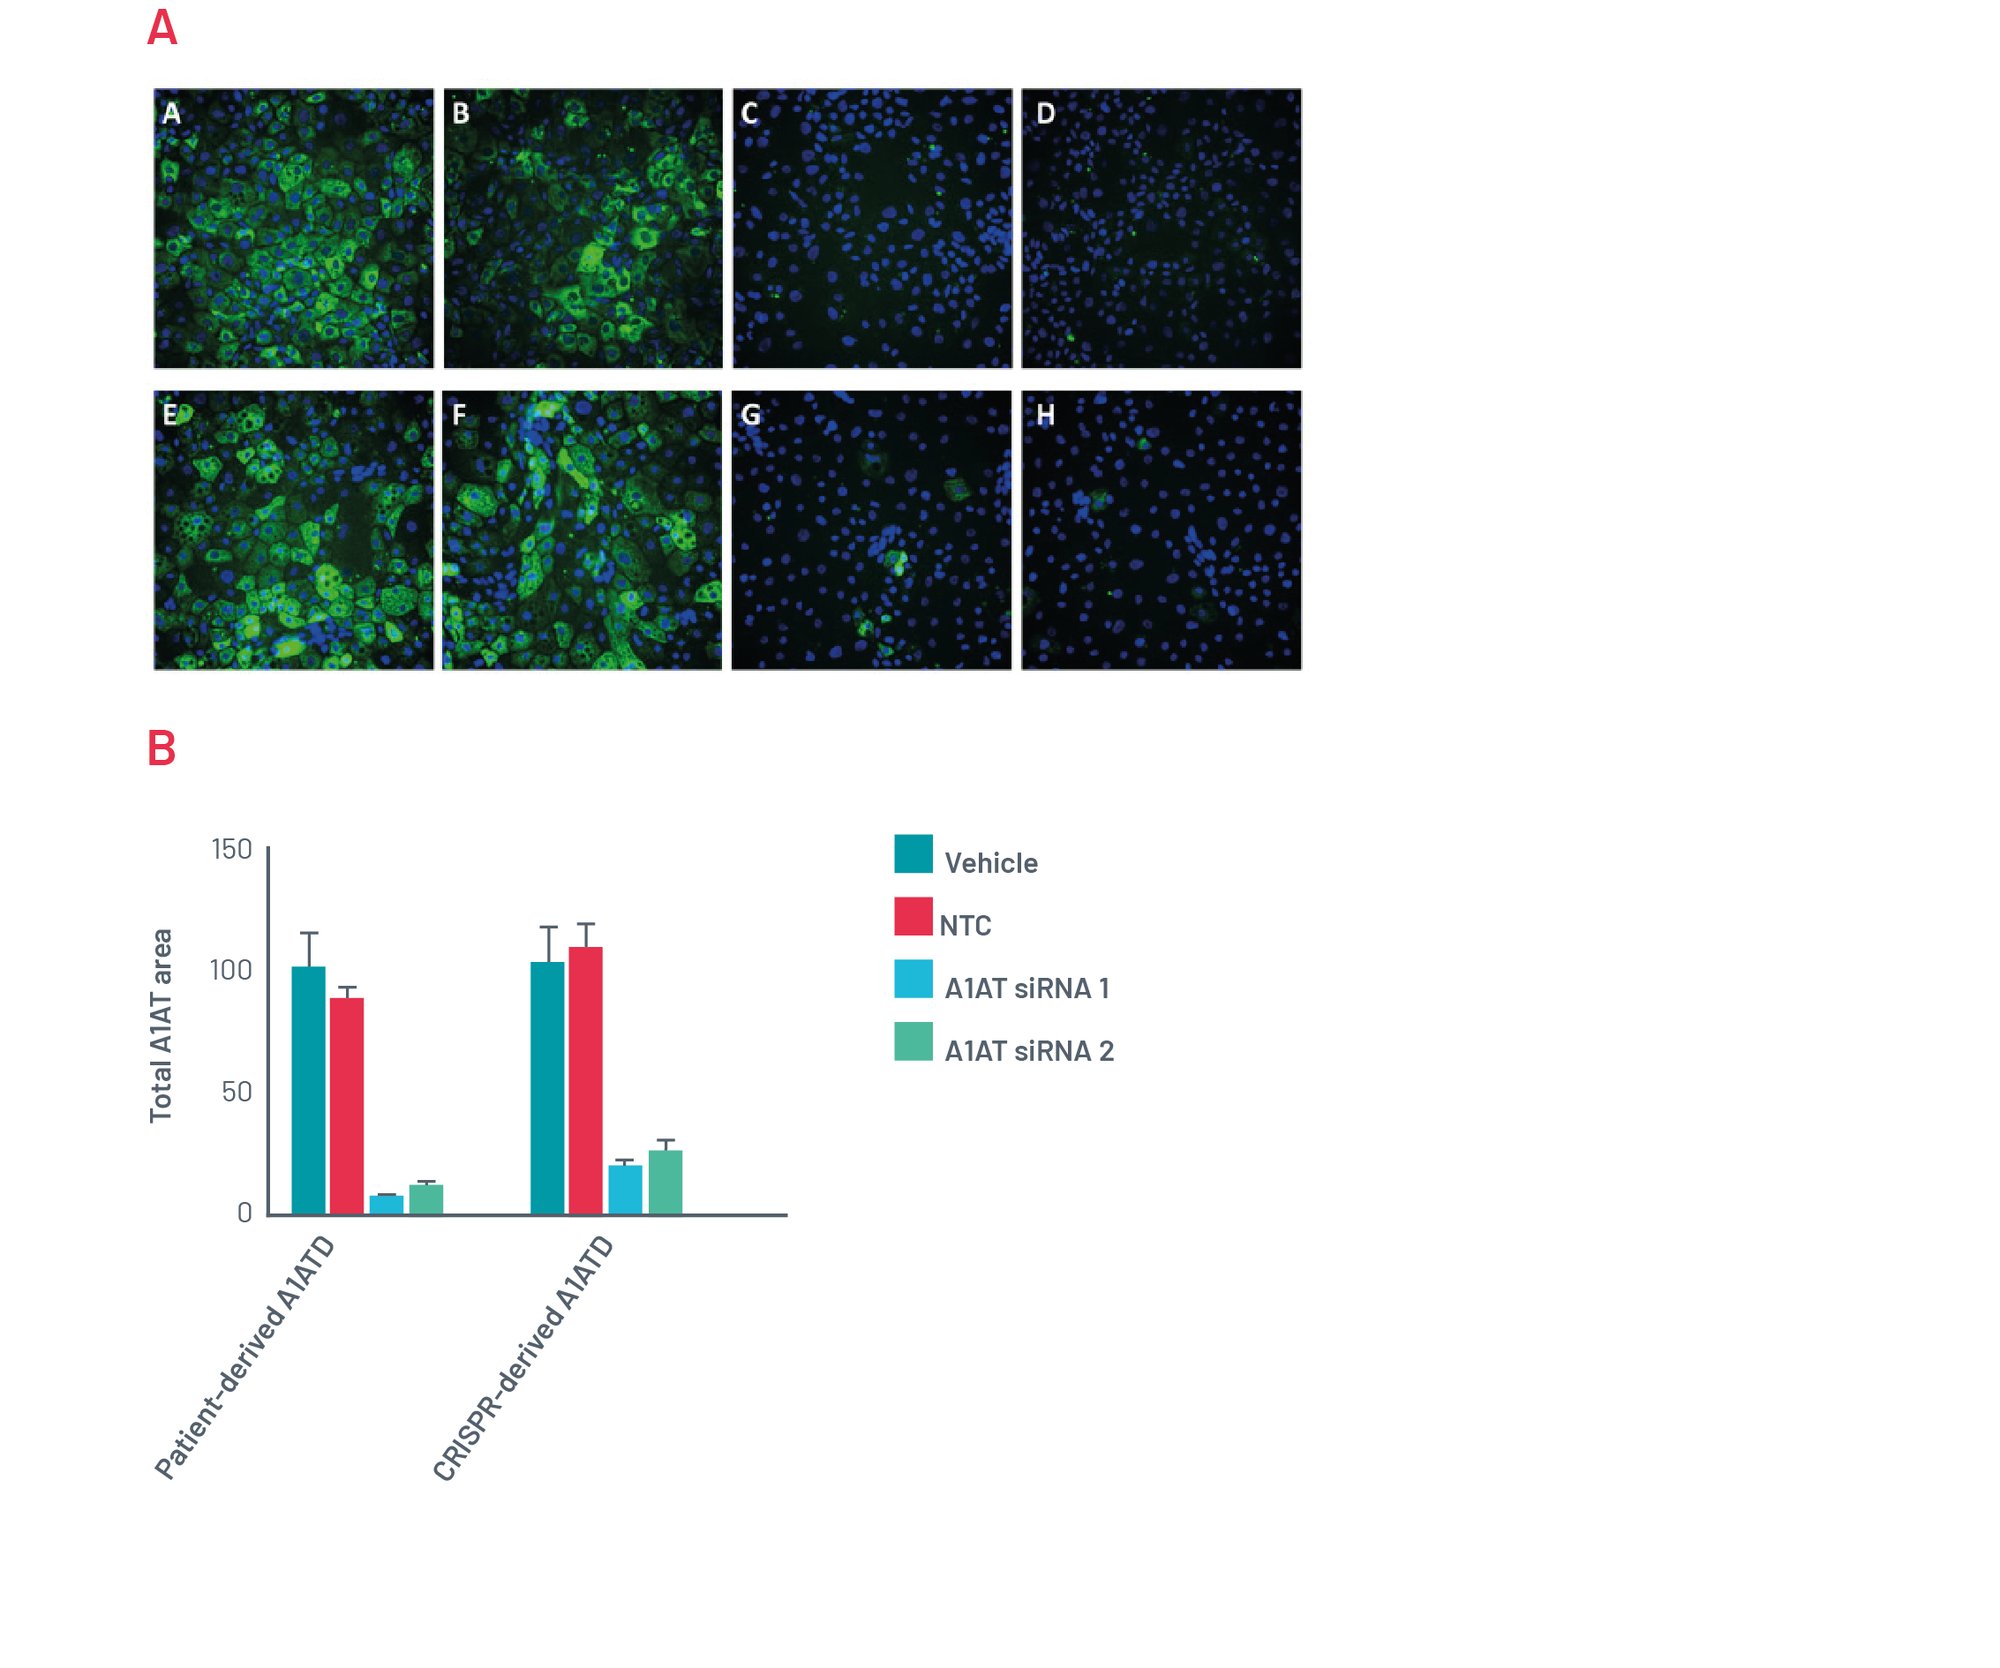
Figure 12. A) Immunofluorescence for polymeric A1AT. Representative pictures of polymeric A1AT staining for patient-derived A1ATD hepatocytes transfected for 72h with Vehicle (A), Scrambled siRNA (B), and two different combinations of siRNA targeting SERPINA1 (C,D). Representative pictures of A1AT staining for CRISPR-derived A1ATD hepatocytes transfected for 72h with Vehicle (E), Scrambled siRNA (F), and two different combinations of siRNA targeting SERPINA1 (G,H). B) Quantification of polymeric inclusions of A1AT per cell in different conditions.
Patient panel
iPSC derived models used in combination with well characterized bioassays can be used to screen drug candidates for efficacy, examine the effects of donor variance and perhaps ultimately inform the make-up of clinical cohorts. Alpha-1 antitrypsin deficiency can be modelled using immunocytochemistry as an endpoint in DefiniGEN's HLCs from a panel of patients.
5) Alpha-1 Antitrypsin Deficiency screening in a panel of patient lines
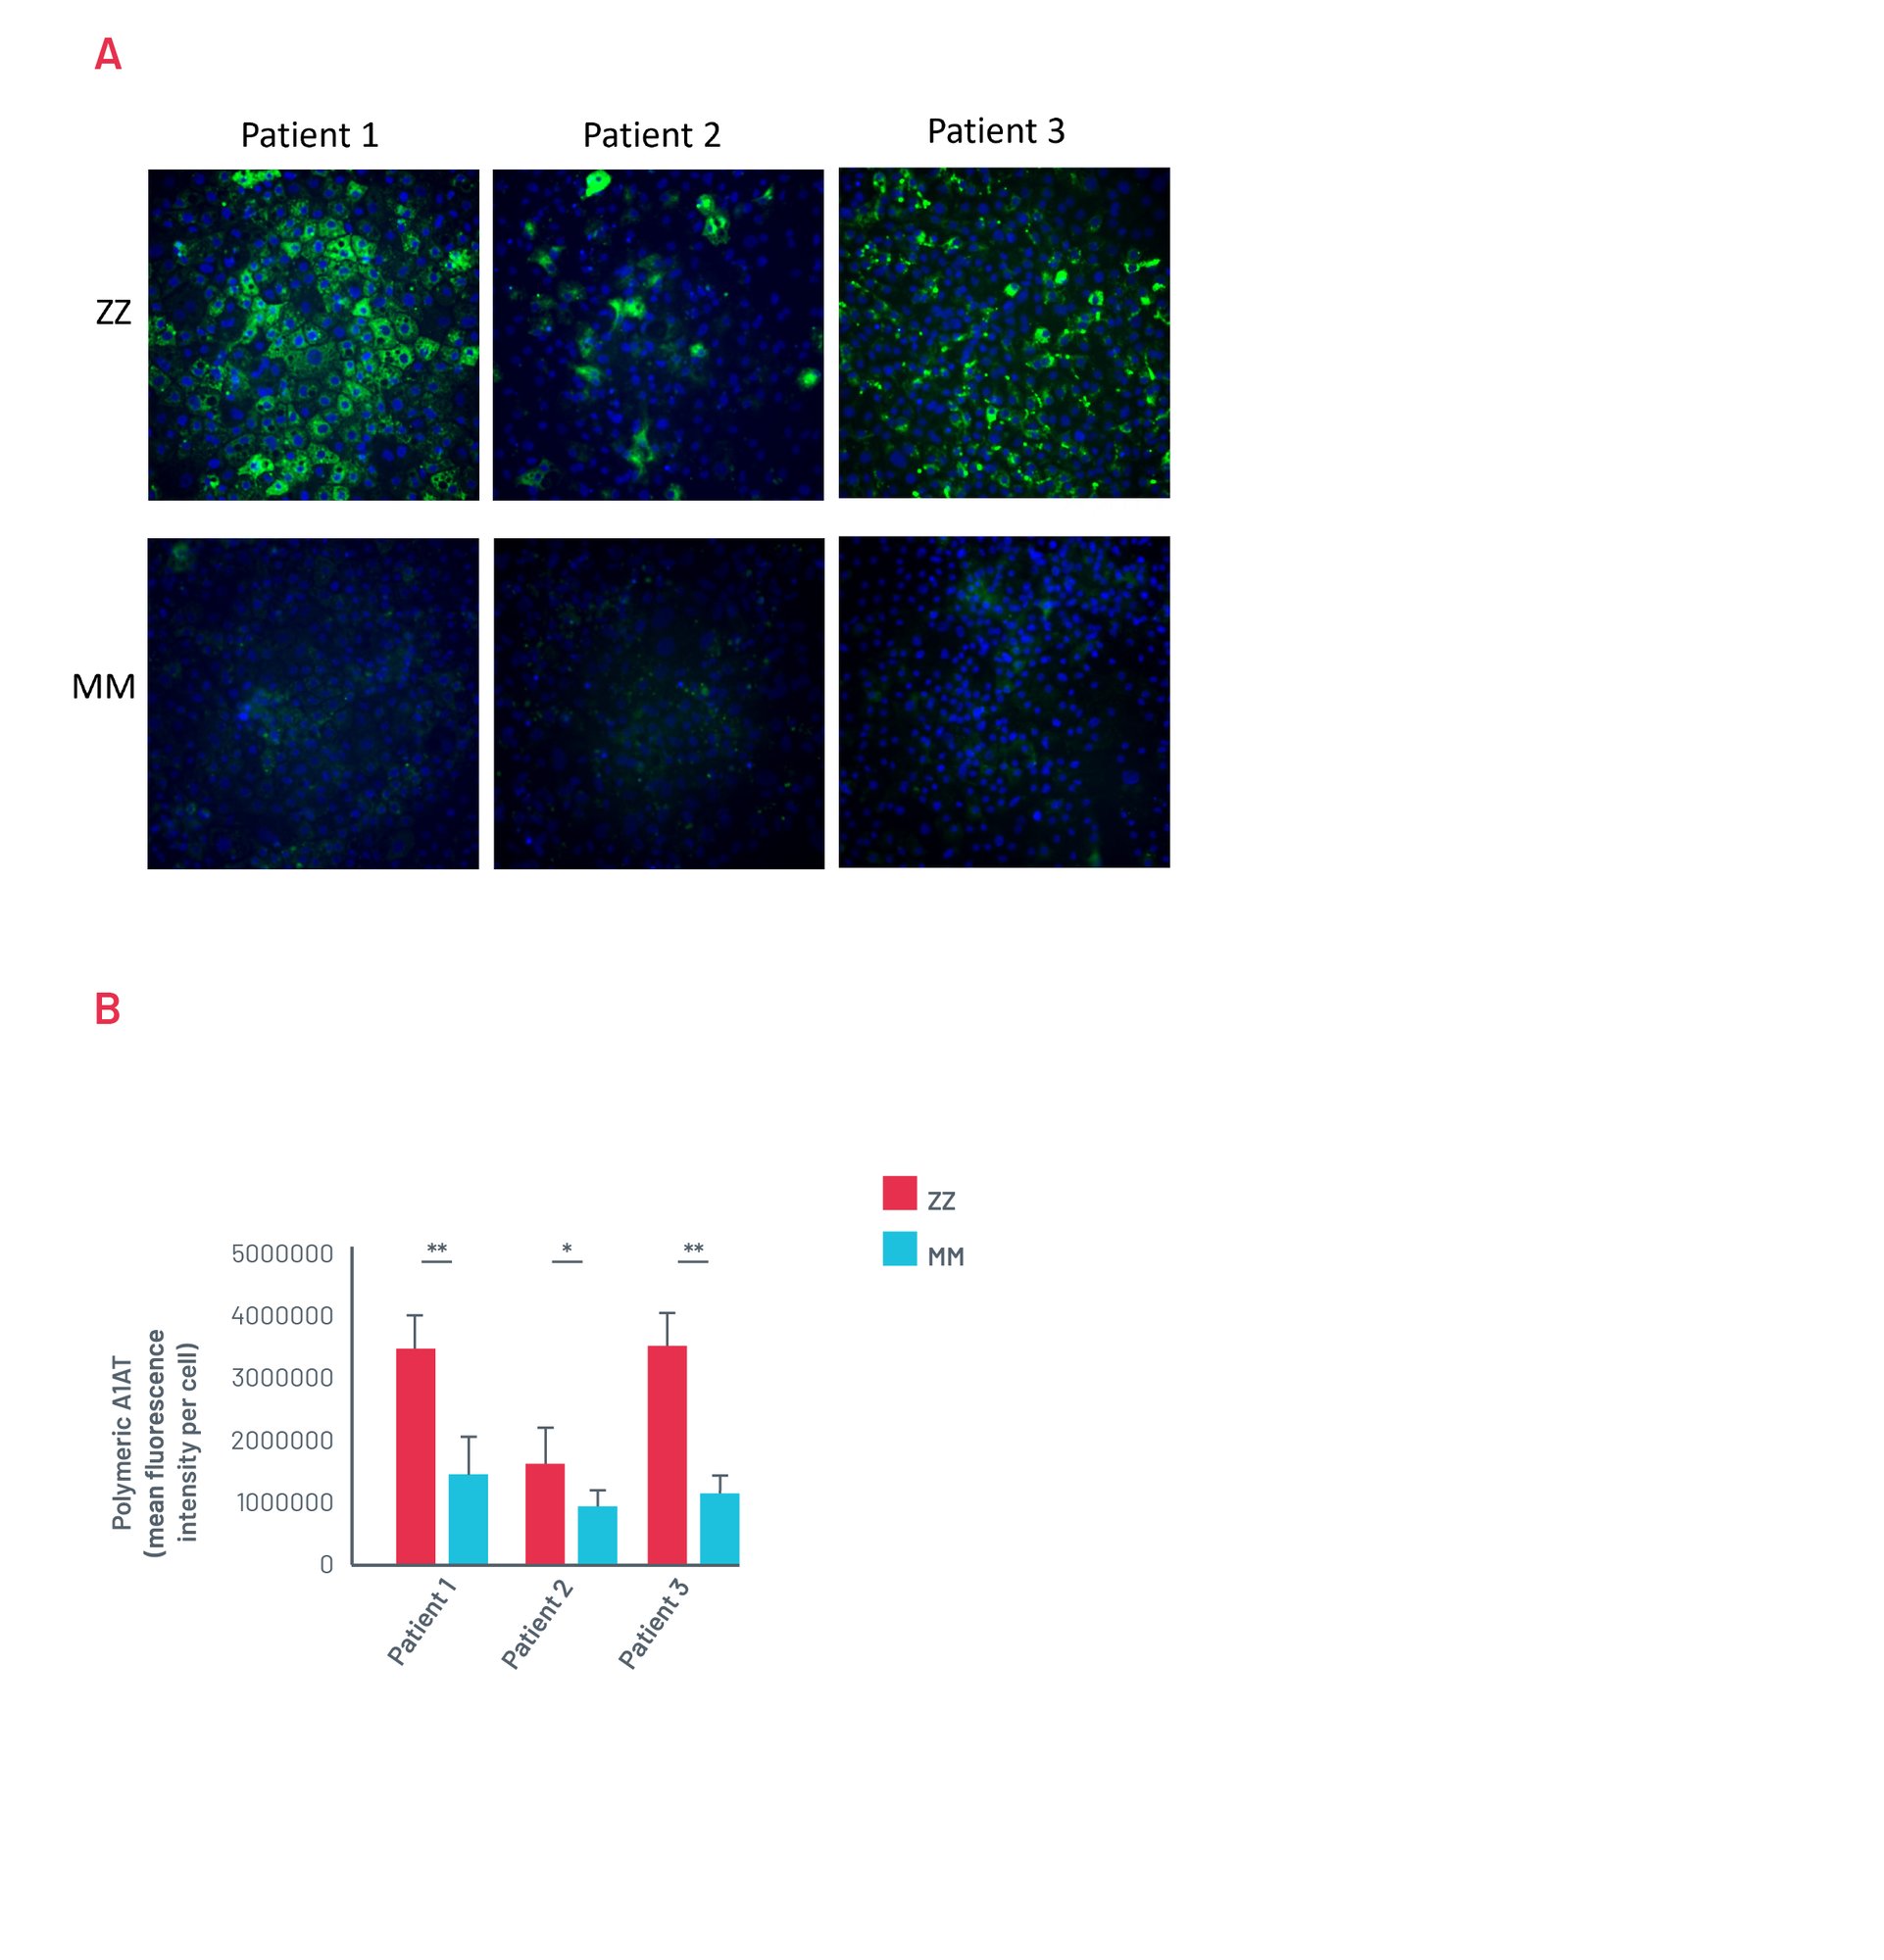
Figure 13. A) Representative images of untreated ZZ-HLCs from a panel of A1ATD patients stained for the polymeric form of A1AT compared to their corrected MM-HLCs. B) Quantification of polymeric A1AT in ZZ-HLCs vs. their corrected MM-HLCs. Data presented as mean ±SEM of n=3 biological replicates. *p<0.05 ** p<0.01.
Patient A1ATD HLCs show A1AT polymer accumulation consistently
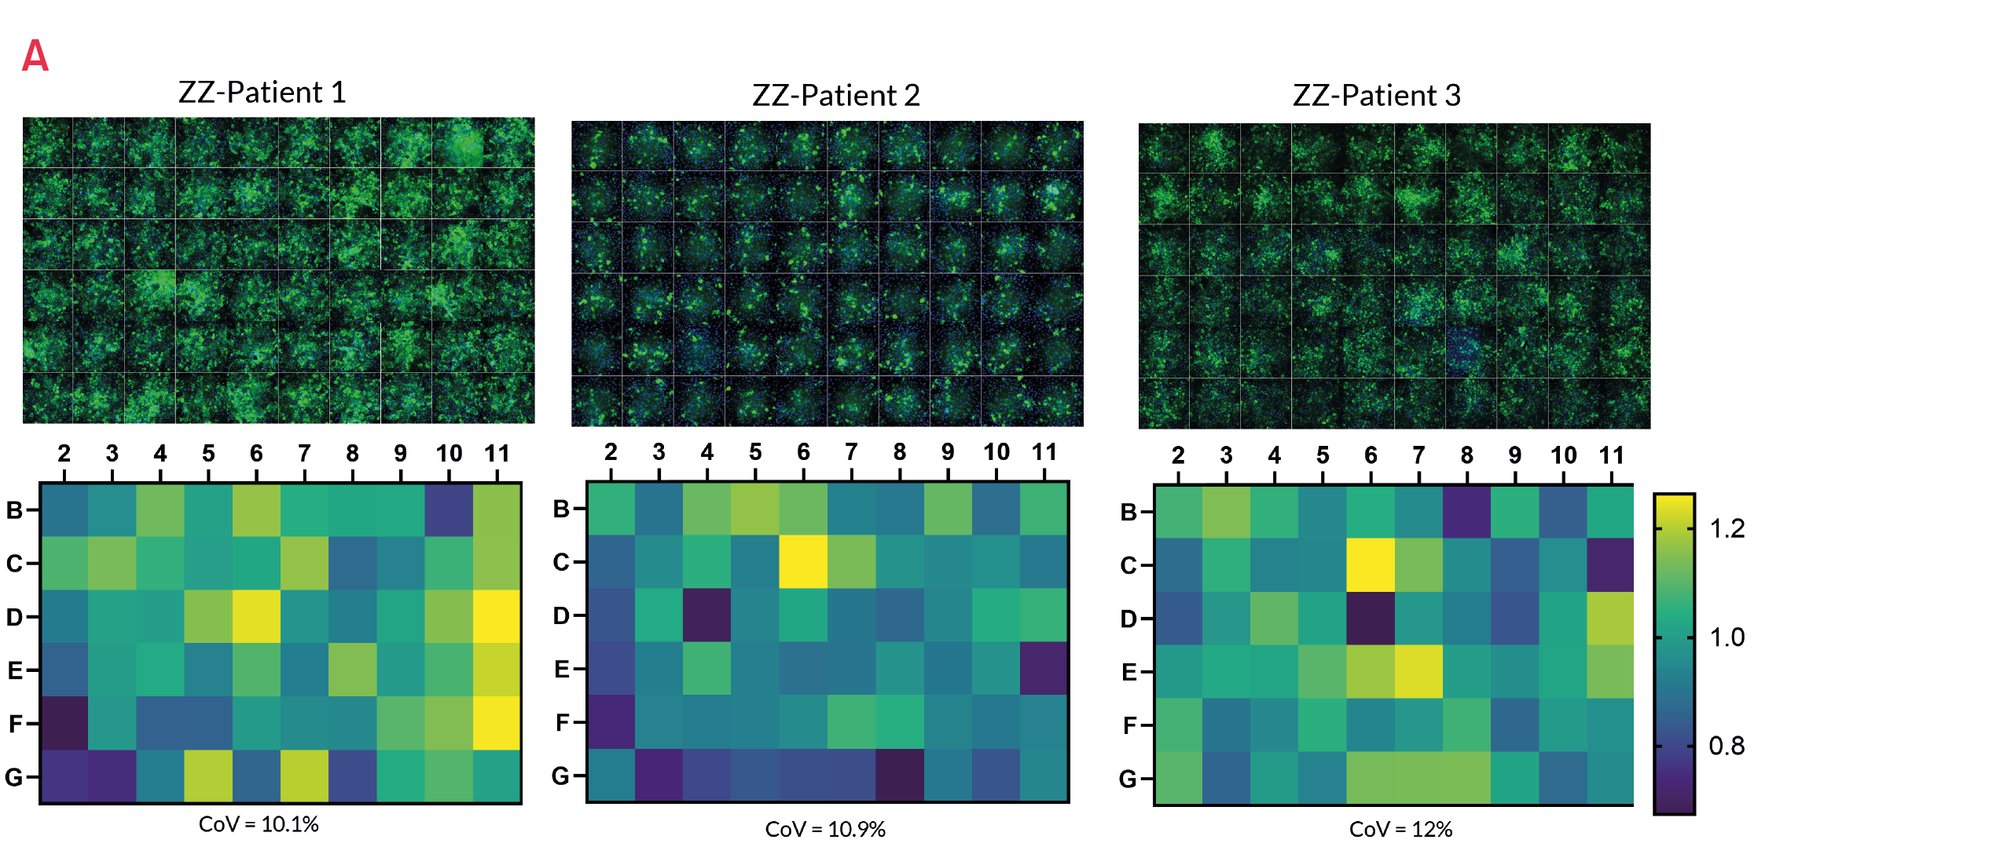
Figure 14. A) Representative images of untreated ZZ-HLCs from a panel of A1ATD patients stained for the polymeric form of A1AT compared to their corrected MM-HLCs. B) Quantification of polymeric A1AT in ZZ-HLCs vs. their corrected MM-HLCs. Data presented as mean ±SEM of n=3 biological replicates. *p<0.05 ** p<0.01.
Patient A1ATD HLCs respond to reference drug carbamazepine (CBZ)
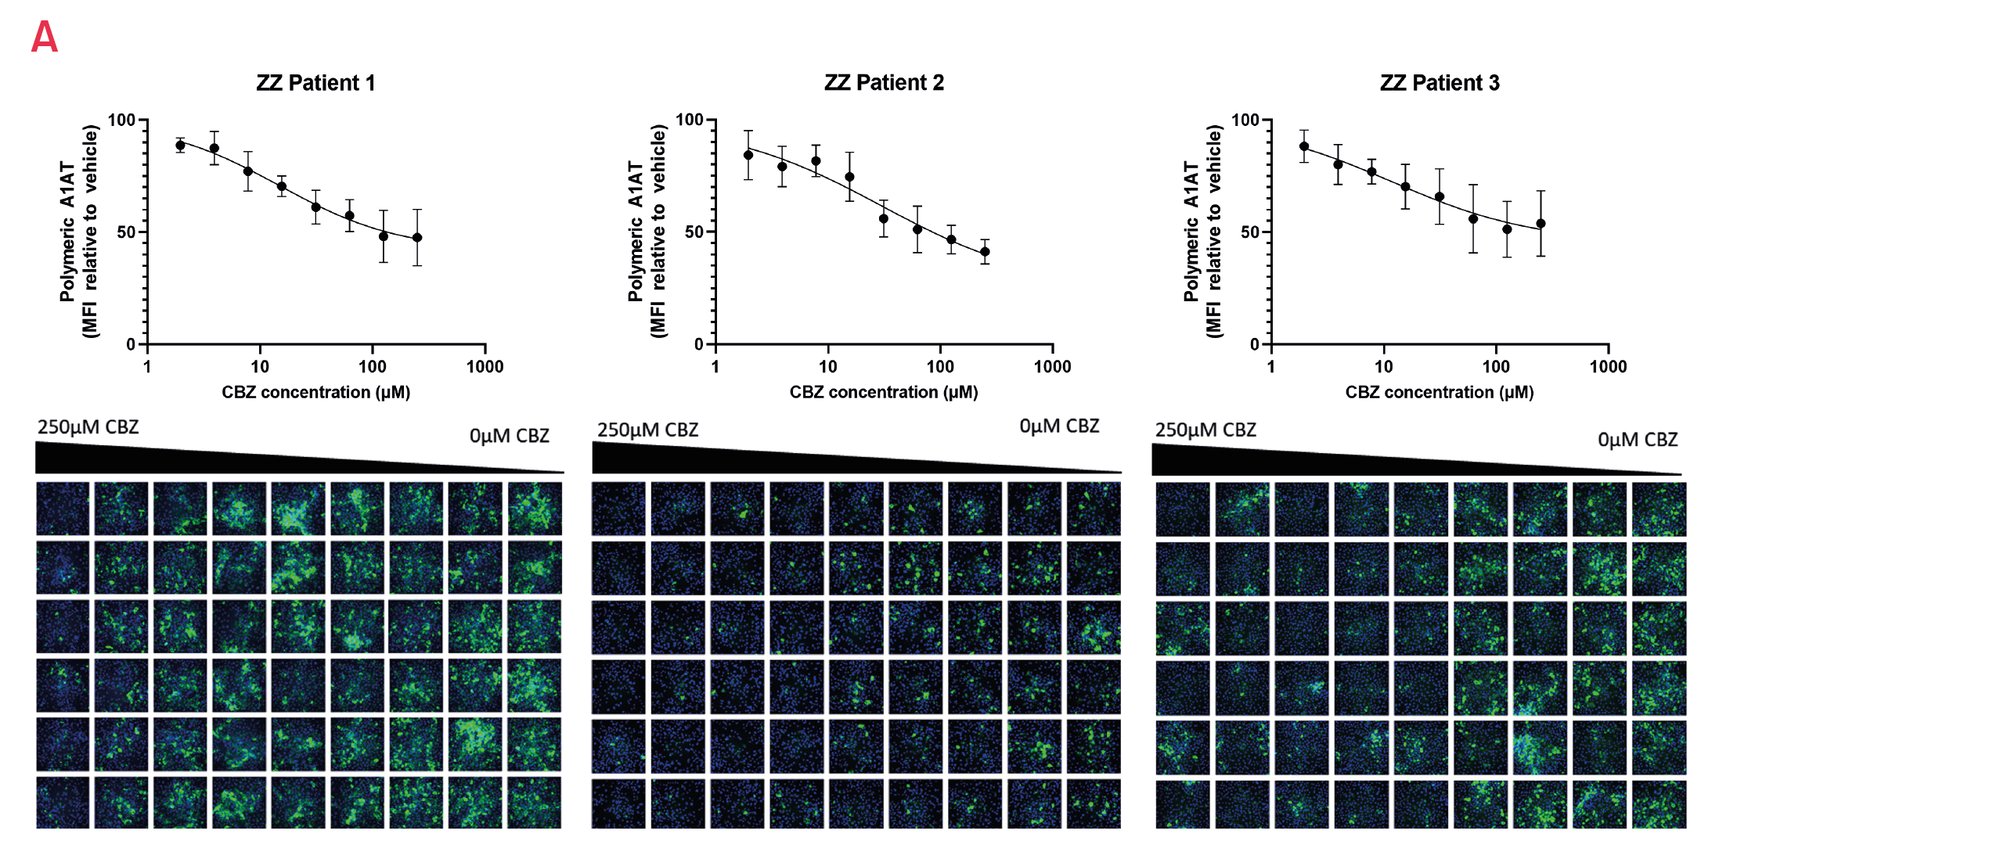
Figure 15. A) Quantification of intracellular polymeric A1AT in 3 different patient-derived ZZ-A1AT HLCs in response to carbamazepine (CBZ) (n=3). Results expressed relative to vehicle set as 100. B) Representative images of the polymeric staining.
Related case studies:


