An optimal platform for drug efficacy and predictive toxicology screening
DefiniGEN Ulti-HEP
The pharmaceutical industry is in high need of efficient and relevant in vitro liver models, which can be incorporated in their drug discovery pipelines to identify potential drugs and their toxicity profiles.
Current liver models often rely on cancer cell lines or primary cells, which both have major limitations. The development of human induced pluripotent stem cells (iPSCs) has created a new opportunity for liver disease modelling, drug discovery and liver toxicity research.
DefiniGEN’s highly developed iPSC-derived hepatocytes, Ulti-HEP, bridge this gap and serve as an optimal platform for drug efficacy and predictive toxicology screening.
DefiniGEN Ulti-HEP have been extensively characterised in response to all the above criteria, revealing their highly metabolic functionality and superiority to existing pre-clinical liver models
Application areas
Ulti-HEP Functionality
DefiniGEN’s proprietary differentiation protocols permit the large scale generation of iPSC-derived hepatocytes (Ulti-HEP) with field leading purity and functionality. Importantly, Ulti-HEP successfully recapitulate key aspects of disease pathophysiology across a wide range of conditions that affect different aspects of liver function.
Advantages
- Demonstrate characteristic hepatocyte cobblestone morphology
- Express comparable levels of liver maturity markers to primary human hepatocytes
- Express higher levels of urea cycle markers and secrete higher levels of urea compared to liver carcinoma cell lines
- Demonstrate a functional gluconeogenesis pathway
- Demonstrate comparable levels of CYP450 markers and CYP3A4 activity to primary human hepatocytes
- Demonstrate functional localization and function of ASGR1 for GalNAc-dependent drug deliveries
- Standardized cell product containing iPSC-derived human hepatocytes producing reproducible and biologically relevant data
Morphology
DefiniGEN Ulti-HEP demonstrate the characteristic hepatocyte cobblestone morphology.
A
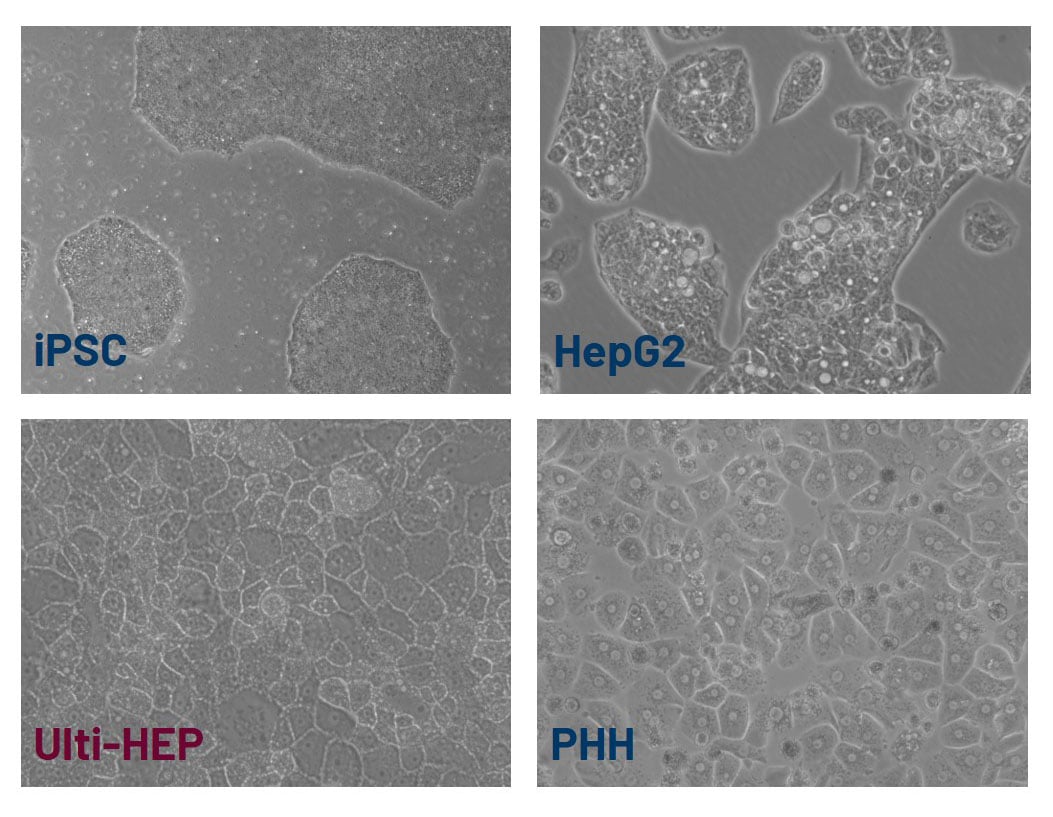
Figure 1: Representative cell morphology pictures of induced pluripotent stem cells (iPSCs), hepatocellular carcinoma HepG2 cells, DefiniGEN Ulti-HEP, and primary human hepatocytes (PHH). The pictures reveal the characteristic cobblestone morphology of Ulti-HEP, and the presence of a uniform monolayer following >3 weeks of iPSC differentiation. Objective: 20x.
Maturity marker analysis
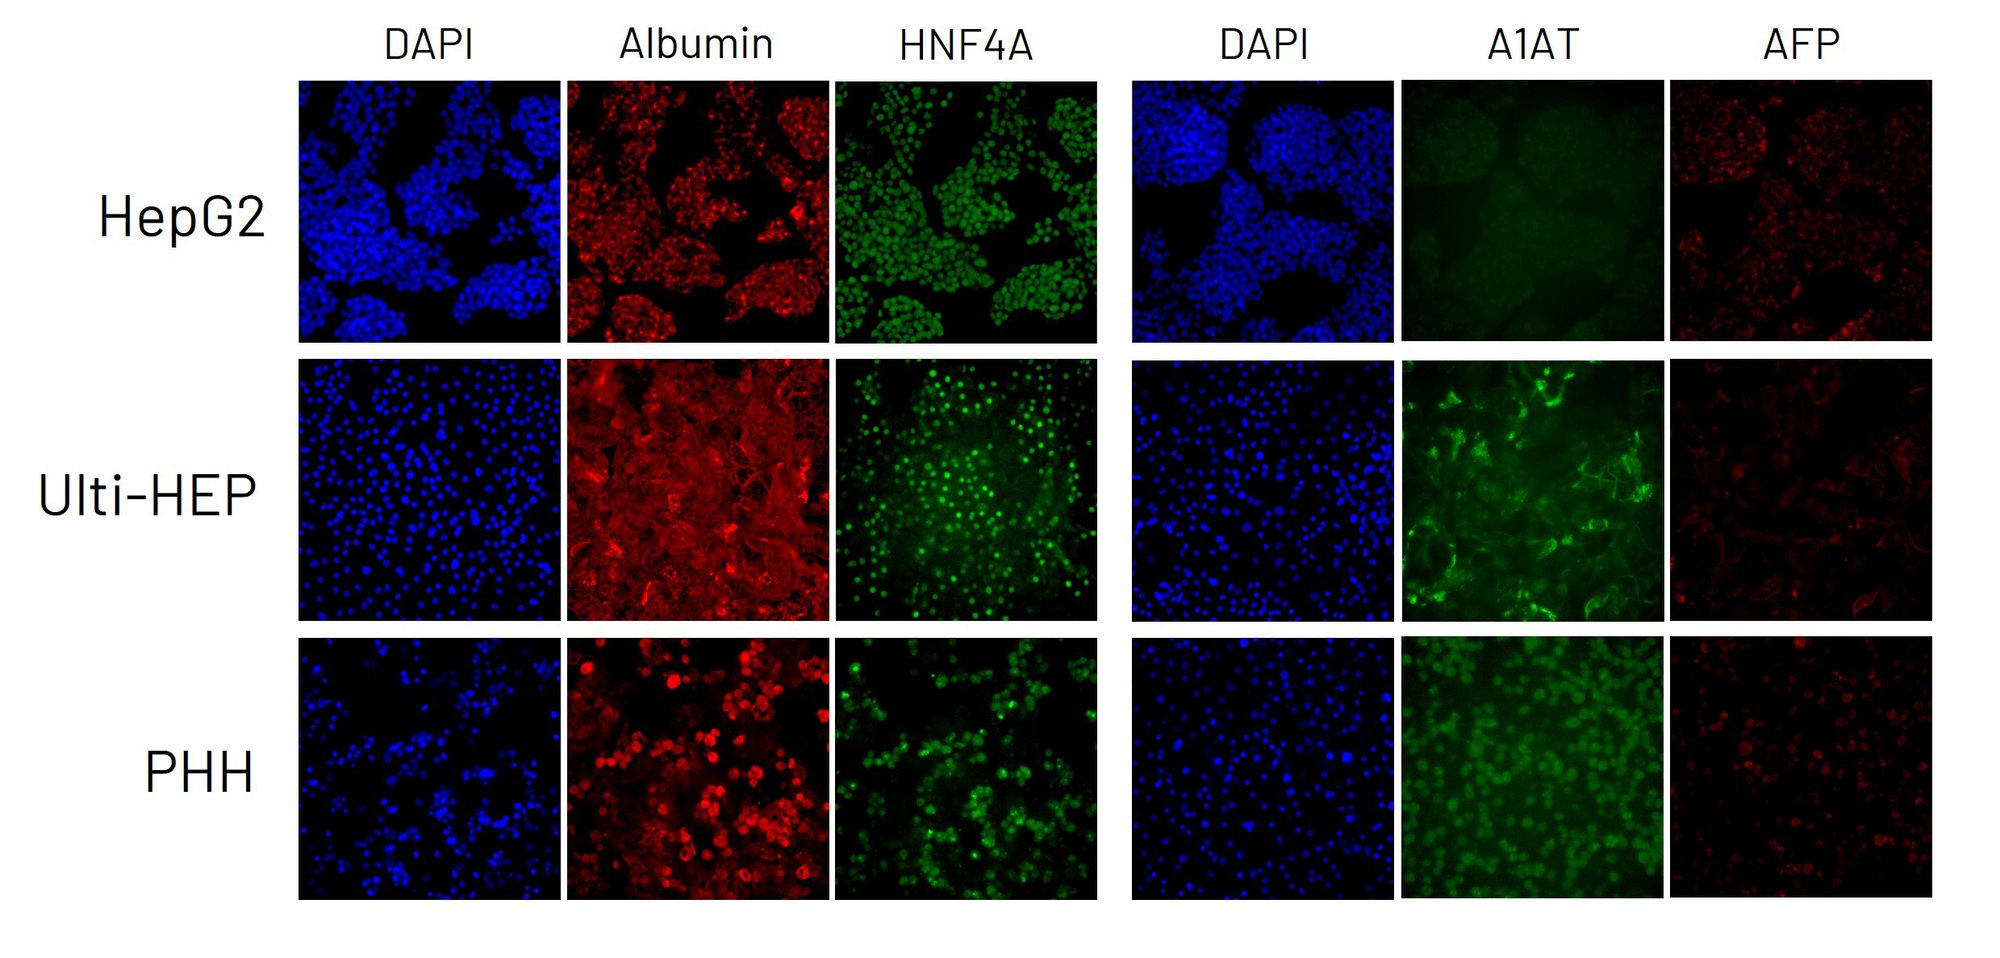
DefiniGEN Ulti-HEP express similar levels of liver maturity markers compared to primary human hepatocytes (PHH).
A
B
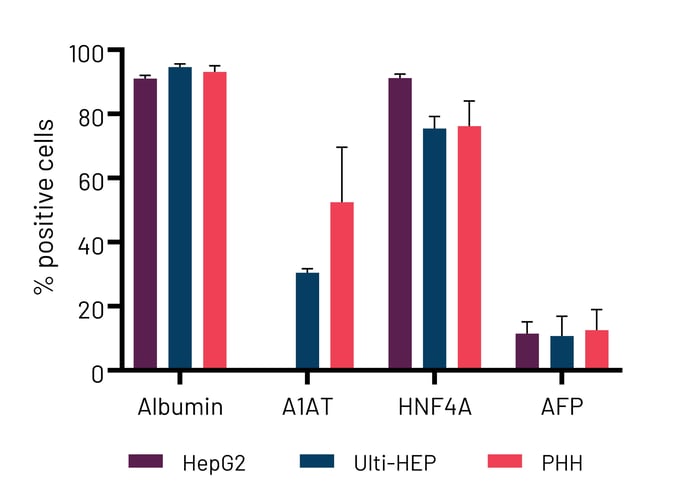
Figure 2: Representative immunocytochemistry pictures and protein quantification showing expression levels of the hepatocyte maturity markers albumin (red), alpha-1-antitrypsin (A1AT; green), HNF4A (green), and AFP (red) in liver carcinoma HepG2 cells, Ulti-HEP, and primary human hepatocytes (PHH; 3 donors). Cells were counterstained with DAPI, and data are presented as mean ±SEM of n=3-4 independent experiments.
Urea cycle marker analysis
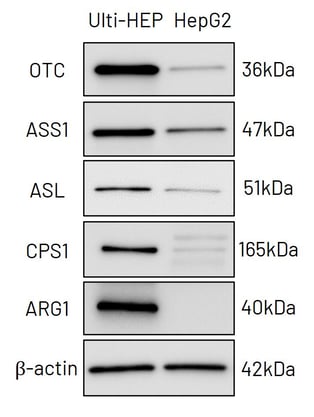
Ulti-HEP express higher levels of urea cycle markers and secrete higher levels of urea compared to liver carcinoma cell lines.
A
B
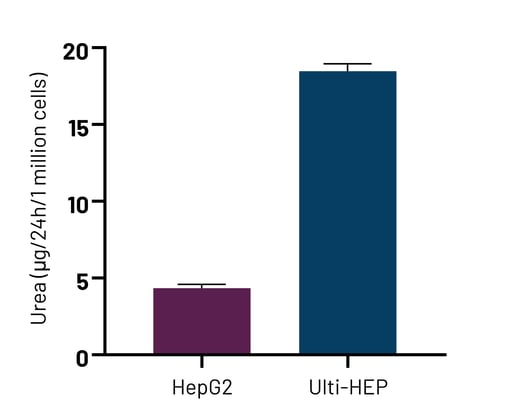
Figure 3: A) Protein expression levels of the urea cycle enzymes OTC, ASS1, ASL, CPS1, and ARG1 in liver carcinoma HepG2 cells and Ulti-HEP. B) Urea secretion in liver carcinoma HepG2 cells and DefiniGEN Ulti-HEP. Data are presented as mean ±SEM of n=3-4 independent experiments.
Functional gluconeogenesis
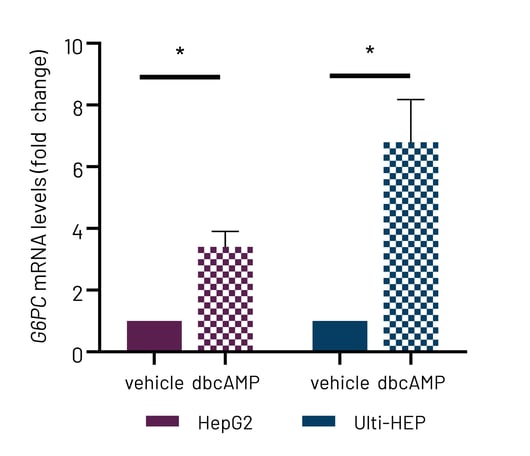
Ulti-HEP demonstrate a functional gluconeogenesis pathway and respond to gluconeogenesis inducers.
A
.png?width=720&height=525&name=Picture6%20(Large).png)
B

C
D
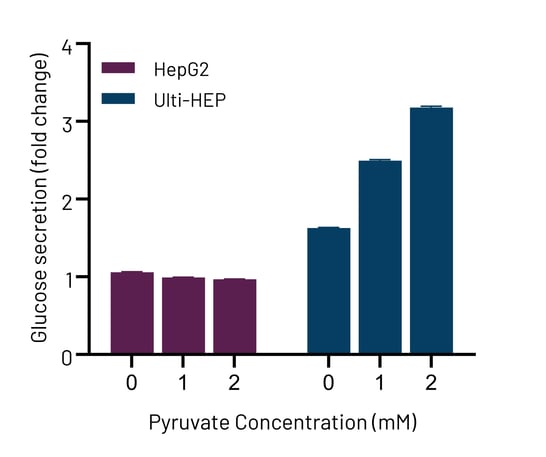
Figure 4: A) Simplified schematic of the gluconeogenesis pathway within human liver. B) G6PC mRNA levels in liver carcinoma HepG2 cells, Ulti-HEP, and primary human hepatocytes (PHH). C) G6PC mRNA levels in liver carcinoma HepG2 cells and Ulti-HEP treated with 0.1mM dbcAMP (gluconeogenesis inducer). D) Glucose secretion in dbcAMP-treated liver carcinoma HepG2 cells and Ulti-HEP upon pyruvate challenge. Data are presented as mean±SEM of n=3-4 independent experiments. mRNA expression data were normalized to 18S rRNA.
CYP450 expression and activity
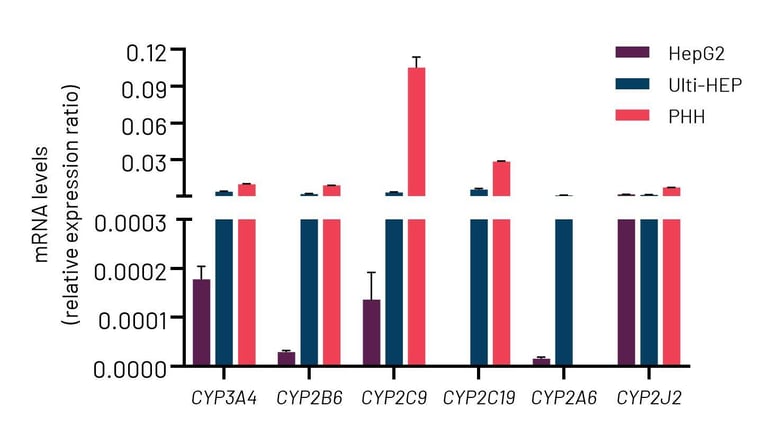
Ulti-HEP demonstrate comparable levels of CYP450 markers and CYP3A4 activity to primary human hepatocytes.
A
B
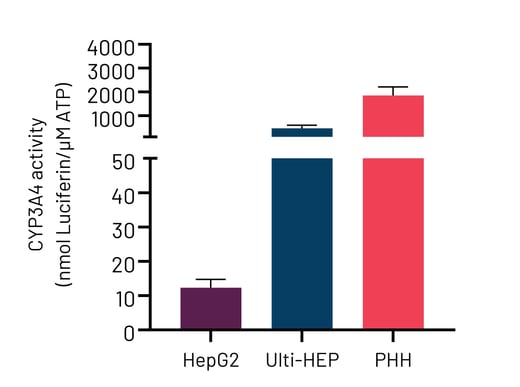
Figure 5: A) mRNA expression levels of Phase I CYP450 genes in liver carcinoma HepG2 cells, Ulti-HEP, and primary human hepatocytes (PHH). B) Basal CYP3A4 activity in liver carcinoma HepG2 cells, Ulti-HEP, and PHH. mRNA data were normalized to the housekeeping gene 18S rRNA and are presented as mean ±SEM of n=3-4 independent experiments. CYP3A4 activity data were normalized to ATP levels and are presented as mean ±SEM of n=3-5 independent experiments. For PHH data, cells from 3 independent donors were used.
Frequently asked questions
Do Ulti-HEPs express ASGR1?
Yes, ASGR1 and ASGR2 has been detected by qPCR analysis and ICC and has been shown to localize on the cell membrane.
Do they have a functional urea cycle?
Yes this has been characterized by gene expression profiling, Western blot analysis and Ornithine stimulated functional analysis.
Can you see CYP expression activity?
Expression of CYPs is detectable by qPCR analysis, but they are lower than Primary Human Hepatocytes (PHH).

